FIGURE SUMMARY
Title

Accelerated Sarcopenia Phenotype in the DJ-1/Park7-Knockout Zebrafish

Authors
Rostad, K.O., Trognitz, T., Frøyset, A.K., Bifulco, E., Fladmark, K.E.
Source
Full text @ Antioxidants (Basel)

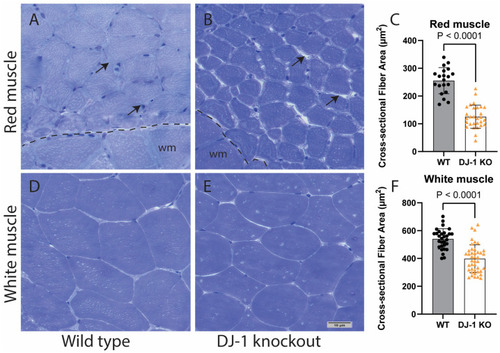
Loss of DJ-1 induces muscle atrophy in zebrafish. Semi-thin cross sections of red (A,B) and white (D,E) muscles from two-year-old male zebrafish were stained with Toluidine Blue (Scale bar 10 µm). Arrows point to extracellular space. White muscles appearing in A and B are labelled wm and separated from red muscle with dotted line. Cross sections were scanned and fibre cross-sectional area measured for red (C) and white (F) muscles. Data are the median ± sd (n = 29–42 DJ-KO and n = 20 WT). p-values were obtained using the Mann–Whitney U test.

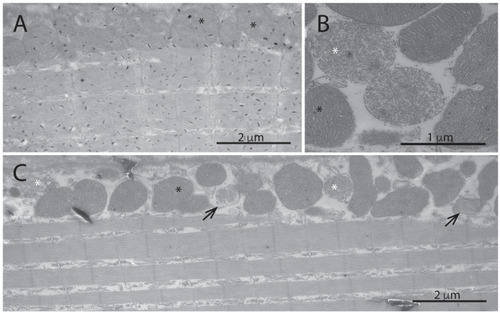
DJ-1-knockout animals show a high degree of degenerating sub-sarcolemma mitochondria in red muscle. Figure shows transmission electron micrographs of red muscle from 18-month-old wild-type (A) and DJ-1-knockout (B,C) zebrafish. Panel B shows examples of healthy (black asterisk) and degenerating (white asterisk) mitochondria found in red muscle. In wild-type red muscle, mitochondria appeared healthy and no degenerating mitochondria were observed in the sub-sarcolemma (A). In the DJ-1 knockout, a high degree of degenerating mitochondria and autophagic structures (arrows) in the sub-sarcolemma were observed (C).

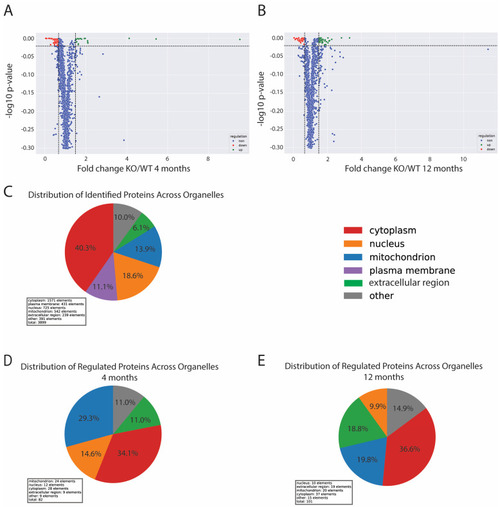
Changes in the muscle proteomes of early and late adults. Figure shows volcano plots of the distribution changes in 4-month-old (A) and 12-month-old (B) DJ-1-knockout zebrafish muscles compared to their respective wild-types. Proteins with significant (p < 0.05) changes larger than 1.5-fold are indicated in green (upregulated) and red (downregulated). Proteins not regulated are in blue. (C) Cellular distribution of total identified proteins used for quantitation. Cellular distribution of regulated proteins when comparing DJ-1-knockout muscles and wild-type muscles at 4 (D) and 12 (E) months.

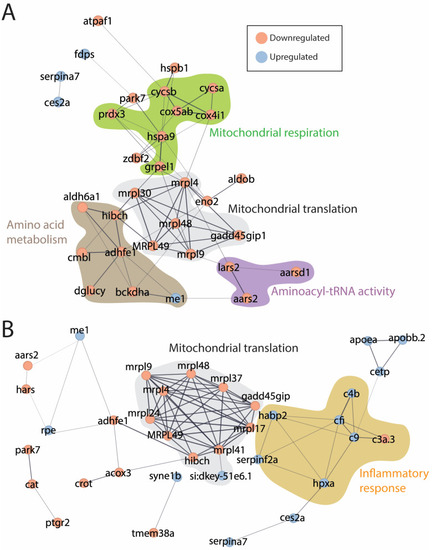
Interaction networks of regulated proteins. (A) 4 months and (B) 12 months. The interaction networks were established from regulated proteins (Supplementary Tables S2 and S3) using Cytoscape (V 3.10) with the STRING network plugin and the zebrafish genome as a background. Proteins without any known interactions were removed.

Absence of DJ-1 facilitates an age-dependent decrease in muscle NAD+/NADH ratio. Metabolites were measured using targeted mass spectrometry on whole muscle from different age groups. A two-way ANOVA analysis was conducted on the (A) NAD+/NADH and (B) NADP+/NADPH ratios of 10 log-transformed data. A significant age-dependent reduction in the NAD+/NADH ratio was found in both DJ-1 KO and WT (F (2, 23) = 37.78, p < 0.0001). No significant age-dependent effect was found in the NADP+/NADPH ratio (F (1, 21) = 0.007642, p = 0.2532). The represented p-values comparing age groups from the same genotype were obtained from a Tukey multiple comparisons test on the Log10-transformed data.

Acknowledgments
This image is the copyrighted work of the attributed author or publisher, and ZFIN has permission only to display this image to its users. Additional permissions should be obtained from the applicable author or publisher of the image. Full text @ Antioxidants (Basel)