FIGURE SUMMARY
Title

Tail Fin Regeneration in Zebrafish: The Role of Non-canonical Crosstalk Between STAT3 and Vitamin D Pathway

Authors
Tesoriere, A., Ghirardo, R., Terrin, F., Sernesi, F., Meneghetti, G., Dalla Valle, L., Dinarello, A., Argenton, F.
Source
Full text @ Int. J. Biol. Sci.

STAT3 phosphorylations regulate regeneration in vitro and in vivo. A Representative pictures, measurements of scratched area and levels of CXCL1 in supernatants of L929 cells after 6 hours of treatment with vehicle and 1 ng/ml IL-6. B Representative pictures, measurements of scratched area and levels of CXCL1 in supernatants of L929 cells after 24 hours of treatment with vehicle, 5 μM AZD1480 or 12.5 μM PD98059. C Representative pictures and quantification of regenerated area of wild type zebrafish tail fins cut at 3-dpf and treated for 2 days either with vehicle or 0.5 ng/ml IL-6. D Representative pictures and quantification of regenerated area of wild type zebrafish tail fins cut at 3-dpf and treated for 2 days either with vehicle or 200 nM LIF.E Representative pictures and quantification of regenerated area of stat3+/+,stat3+/- and stat3-/- tail fins cut at 3-dpf and analysed at 3 dpa. F Representative pictures and quantification of regenerated area of wild type zebrafish fins cut at 3-dpf and treated for 3 days either with DMSO, 50 μM AG490 or 12.5 μM PD98059. Mean ± SEM. *p < 0.05, **p < 0.01, ***p < 0.001, ****p < 0.0001.

Generation of stat3S→A751 zebrafish knock-in line. A Sequence of the donor DNA used to generate the KI. The mutation (gca) is highlighted in red and is flanked by a 36-nt and a 90-nt homology arms. B Representative picture of allele-specific PCRs routinely performed to genotype KI fish: heterozygotes are positive for both alleles, whereas homozygotes are positive for only one. C Morphological analysis (in blue: eye diameter; in orange: eye area; in yellow: body length) and representative pictures of 6-dpf stat3S751/S751, stat3S751/A751 and stat3A751/A751 larvae. Scale bar: 200 μm. D Standard light/dark behavioral assay performed on 6-dpf stat3S751/S751, stat3S751/A751 and stat3A751/A751 larvae. E Genotype distribution of stat3S751/S751, stat3S751/A751 and stat3A751/A751 zebrafish at 6 dpf, 15 dpf, and 60 dpf. F Fluorescent image of Tg(7xStat3-Hsv.Ul23:EGFP)ia28 intestines of 6-dpf stat3S751/S751, stat3S751/A751 and stat3A751/A751 larvae and relative fluorescence quantification. Scale bar: 100 μm. G Expression levels of stat3, socs3a, vegfa and cebpb in 6-dpf stat3S751/S751 and stat3A751/A751 larvae. H Regeneration rate of 6-dpf stat3S751/S751, stat3S751/A751 and stat3A751/A751 larvae at 3 dpa. Mean ± SEM. *p < 0.05, **p < 0.01, ***p < 0.001, ****p < 0.0001.

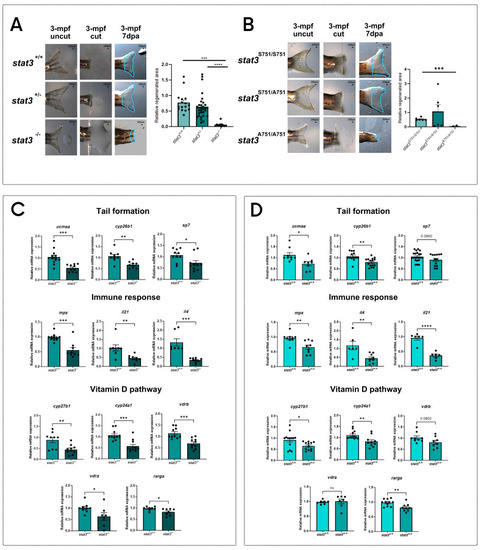
pS727 Stat3 regulates inflammation, bone metabolism and vitamin D pathway. Representative pictures of regenerated tail fin of stat3+/+, stat3+/- and stat3-/- adult zebrafish and relative quantification. The adult homozygous mutants are rare escapers that manage to reach this developmental stage. B Representative pictures of regenerated tail fin of stat3S751/S751, stat3S751/A751 and stat3A751/A751 adult zebrafish and relative quantification. The adult homozygous mutants are rare escapers that manage to reach this developmental stage. C Expression level of ucmaa, cyp26b1, sp7, mpx, il21, il4, cyp27b1, cyp24a1, vdrb, vdra, and rarga in stat3+/+ and stat3-/- larvae. D Expression level of ucmaa, cyp26b1, sp7, mpx, il21, il4, cyp27b1, cyp24a1, vdrb, vdra, and rarga in 6-dpf stat3S751/S751 and stat3A751/A751 larvae. Mean ± SEM. *p < 0.05, **p < 0.01, ***p < 0.001, ****p < 0.0001.

Vitamin D treatment improves tail fin regeneration. A Representative pictures and quantification of regenerated area of wild type zebrafish tail fins cut at 3-dpf and treated for 2 days either with vehicle or 0.5 nM vitamin D. B Expression levels of cyp27b1, cyp24a1, vdrb, vdra and rarga in whole body, tail and regenerated tail samples from 5-dpf larvae treated for 2 days either with vehicle or 0.5 nM vitamin D. C Expression levels of mpx, il4, and il21 in whole body, tail and regenerated tail samples from 5-dpf larvae treated for 2 days either with vehicle or 0.5 nM vitamin D. D Expression levels of cyp26b1, ucmaa, and sp7 in whole body, tail and regenerated tail samples from 5-dpf larvae treated for 2 days either with vehicle or 0.5 nM vitamin D. Mean ± SEM. *p < 0.05, **p < 0.01, ***p < 0.001, ****p < 0.0001.

Vitamin D partially recovers the regeneration impairment of stat3 mutants. A Representative pictures and relative quantification of stat3+/+ and stat3-/- larval tail fins cut at 3 dpf and treated for 2 days with vehicle or 0.5 nM vitamin D. B Representative pictures and relative quantification of stat3S751/S751 and stat3A751/A751 larval tail fins cut at 3 dpf and treated for 2 days with vehicle or 0.5 nM vitamin D. Mean ± SEM. **p < 0.01, ***p < 0.001, ****p < 0.0001.

STAT3-VDR molecular interplay. A Analysis of sequences of proximal promoter of vdra, vdrb, cyp24a1, cyp27b1 (A) and stat3 (A'); representative schemes of SBE (A) and VRE (A') consensus sequences. B Expression levels of stat3, socs3a, cebpb and vegfa in wild type 5-dpf zebrafish larvae treated for 2 days with vehicle or 0.5 nM vitamin D. C Expression level of Stat3 and Socs3 in L929 cells treated either with vehicle or 200 nM vitamin D for 24 hours. D Protein level quantification of pSTAT3(S727), pSTAT3(Y705) and pERK1/2, (respectively normalized on STAT3, STAT3 and ERK1/2,) of L929 cells treated either with vehicle or 200 nM vitamin D for 24 hours. Mean ± SEM. *p < 0.05, ****p < 0.0001.

Acknowledgments
This image is the copyrighted work of the attributed author or publisher, and ZFIN has permission only to display this image to its users. Additional permissions should be obtained from the applicable author or publisher of the image. Full text @ Int. J. Biol. Sci.