FIGURE SUMMARY
Title

Oscillatory DeltaC Expression in Neural Progenitors Primes the Prototype of Forebrain Development

Authors
Nian, F.S., Liao, B.K., Su, Y.L., Wu, P.R., Tsai, J.W., Hou, P.S.
Source
Full text @ Mol. Neurobiol.

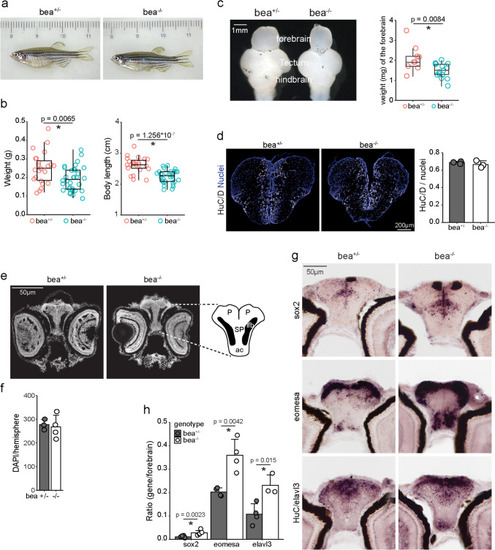
Increased neurons and progenitors in the forebrain of dlc mutant larval zebrafish but no gross abnormality in adults. a Image of dlc mutant and control adult zebrafish. b Quantitative analysis of body index of adult zebrafish. c Image and quantitative analysis of forebrain in dlc mutant and control adult zebrafish. d Image and quantitative analysis of the ratio of HuC/D-positive cells to total cells (nuclei) in adult zebrafish forebrains. Nuclei: DAPI staining. e, f Image and quantitative analysis of the number of nuclei in the forebrains of 5 dpf larval zebrafish. Nuclei: DAPI staining. P, pallium; SP, subpallium; lfb, lateral forebrain bundle; ac, anterior commissure [13]. g, h In situ hybridization and quantitative analysis of larval zebrafish at 5 dpf using probes specifically targeting progenitor gene sox2, neuronal precursor gene eomesa, and neuronal gene HuC/elavl3. Scale bars are indicated. Error bars represent standard deviation, and data points are shown in dots. * Significance with p value < 0.05 by Student’s t-test

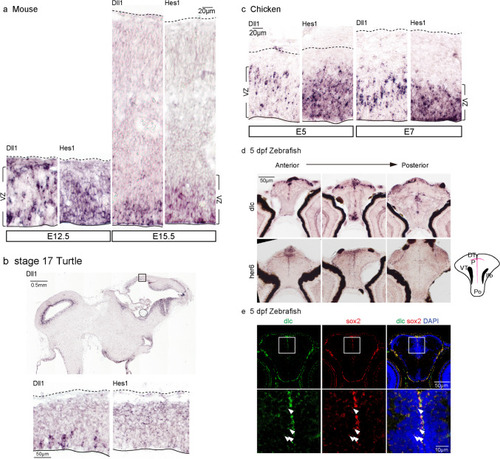
Expression pattern of Dll1, Hes1, and orthologs in developing vertebral forebrain. a In situ hybridization of Dll1 and Hes1 in developing mouse dorsal telencephalon at E12.5 and E15.5 using probes specifically targeting mouse Dll1 and Hes1 mRNA. b In situ hybridization of Dll1 and Hes1 in developing dorsal telencephalon of stage 17 turtles using probes specifically targeting turtle Dll1 and Hes1 mRNA. c In situ hybridization of Dll1 and Hes1 in developing chicken dorsal telencephalon at E5 and E7 using probes specifically targeting chicken Dll1 and Hes1 mRNA. d In situ hybridization of dlc and her6 in developing forebrain of 5 dpf larval zebrafish using probes specifically targeting zebrafish dlc and her6 mRNA. e Two-color in situ hybridization of dlc and sox2 in developing forebrain of 5 dpf larval zebrafish. Colocalized signals are indicated by arrowheads. P, pallium; DT, dorsal thalamus (thalamus); VT, ventral thalamus (prethalamus); Po, preoptic region; lfb, lateral forebrain bundle [13]. Scale bars are indicated

dlc-positive cells were stochastically distributed in the forebrain of larval zebrafish. a Quantitative analysis of the relative minimal distance between a signal-positive cell to the nearest signal-positive cell in the developing forebrain of 5 dpf larval zebrafishes, E5 chicken, and E12.5 mouse. * represent significance with p value < 0.01 by Student’s t-test. b–d L() analysis of the spatial distribution of Dll1-positive cells in the developing forebrain of E12.5 mouse (d), Dll1-positive cells in the developing forebrain of E5 chicken (c), and dlc-positive cells in the developing forebrain of 5 dpf larval zebrafish (d)

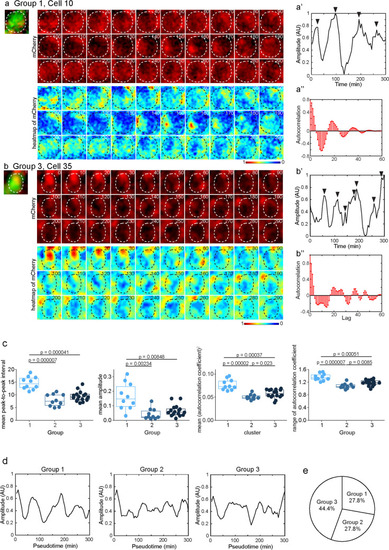
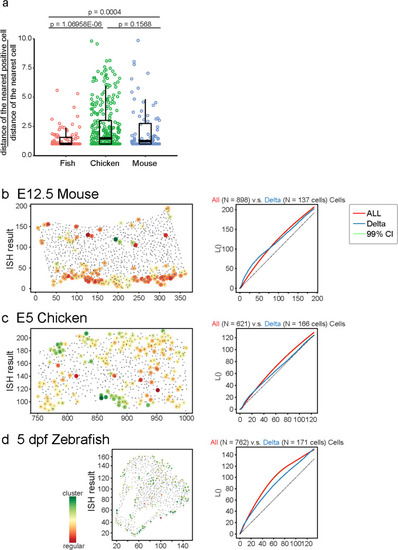
Fluctuating dlc expression was not synchronized in the developing forebrain of larval zebrafish. a, b Time-lapse imaging of mCherry signals and the heatmap of corrected mCherry signals in GFP cells (8*8 μm). Dashed lines delineate the cellular boundary of GFP cells. Time (minutes) was indicated. a’, b’ Line charts show the amplitude of mCherry signals in cell 10 (a’) and cell 35 (b’). a”, b” Curve diagrams show the autocorrelation results of cell 10 (a”) and cell 35 (b”). a, a’, a” Time-lapse imaging and the analyses of cell 10 in group 1. b, b’, b” Time-lapse imaging and the analyses of cell 35 in group 3. c Box and dot plots show the mean peak-to-peak interval, mean amplitude, mean square of autocorrelation coefficient, and range of autocorrelation coefficient in three groups. p values by Student’s t-test are indicated. d Line charts show the mean amplitude in each group. e The pie chart shows the composition of analyzed GFP cells

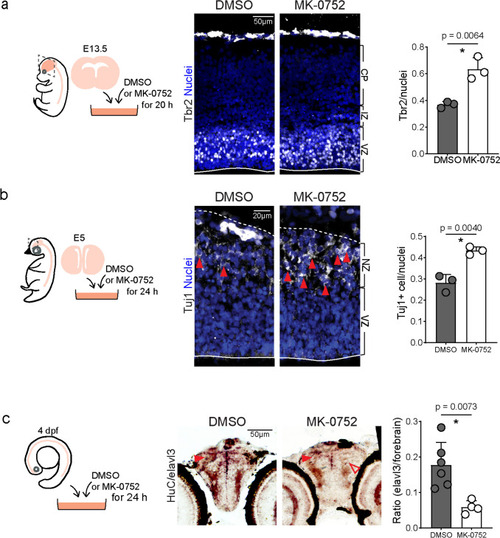
Blocking Notch signaling increased neural precursor numbers in developing mouse and chicken dorsal telencephalon but not in the larval zebrafish forebrain. a Schematic diagram of experimental design of MK-0752 treatment in developing mouse cerebral cortex, immunostaining and quantitative analysis of Tbr2-positive cells (nuclei) in VZ. VZ, ventricular zone; IZ, intermediate zone; CP, cortical plate. Solid lines indicate ventricular surface. Nuclei: DAPI staining. b Schematic diagram of experimental design of MK-0752 treatment in developing chicken pallium, immunostaining, and quantitative analysis of Tuj1-positive cells (nuclei) in NZ. Tuj1-positive cells are defined as nuclei surrounded by Tuj1-positive signals (arrowhead). Dashed lines indicate the pia surface and solid lines indicate the ventricular surface. Nuclei: DAPI staining. c Schematic diagram of experimental design of MK-0752 treatment in developing larval zebrafish forebrain, in situ hybridization, and quantitative analysis of area with HuC/elavl3 signals. Close arrowheads indicate positive signals and open arrowheads indicate negative signals. Scale bars are indicated. Error bars represent standard deviation, and data points are shown in dots. *Significance with p value < 0.01 by Student’s t-test

Acknowledgments
This image is the copyrighted work of the attributed author or publisher, and ZFIN has permission only to display this image to its users. Additional permissions should be obtained from the applicable author or publisher of the image. Full text @ Mol. Neurobiol.