IMAGE

Fig. 3

ID
ZDB-IMAGE-250306-10
Source
Figures for Nian et al., 2024
Image
Figure Caption

Fig. 3

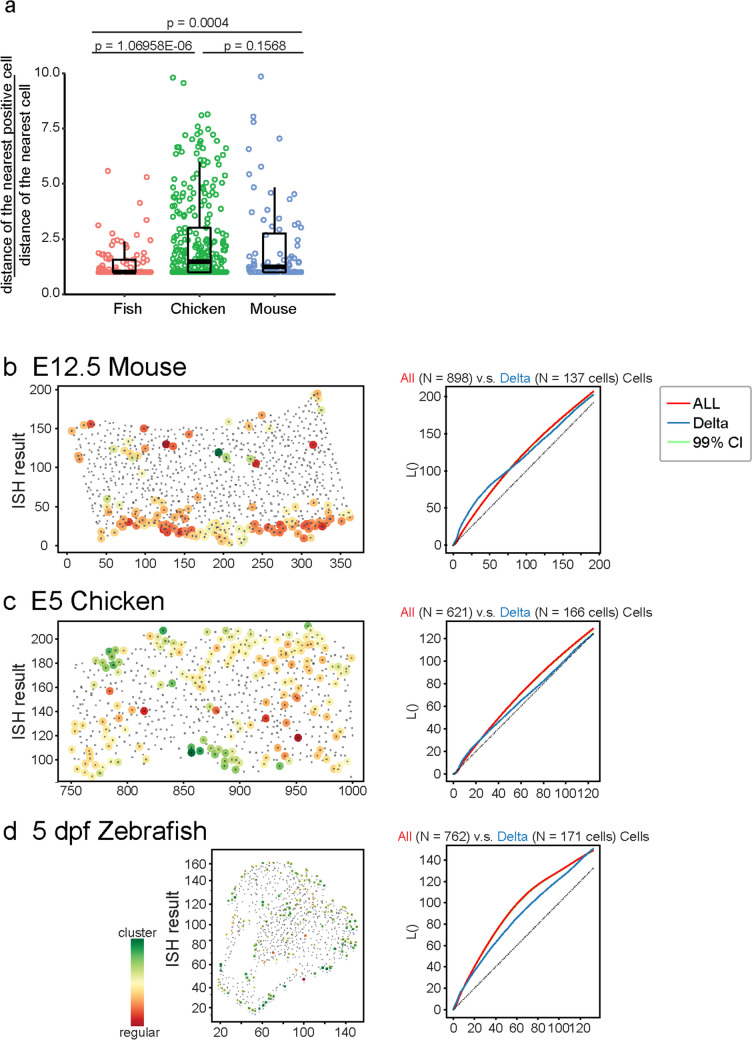
dlc-positive cells were stochastically distributed in the forebrain of larval zebrafish. a Quantitative analysis of the relative minimal distance between a signal-positive cell to the nearest signal-positive cell in the developing forebrain of 5 dpf larval zebrafishes, E5 chicken, and E12.5 mouse. * represent significance with p value < 0.01 by Student’s t-test. b–d L() analysis of the spatial distribution of Dll1-positive cells in the developing forebrain of E12.5 mouse (d), Dll1-positive cells in the developing forebrain of E5 chicken (c), and dlc-positive cells in the developing forebrain of 5 dpf larval zebrafish (d)

Acknowledgments
This image is the copyrighted work of the attributed author or publisher, and ZFIN has permission only to display this image to its users. Additional permissions should be obtained from the applicable author or publisher of the image. Full text @ Mol. Neurobiol.