
- Title
-
Aspirin reduces Ponatinib-induced cardiovascular toxic phenotypes and death in zebrafish
- Authors
- Yu, R., Ai, N., Huang, C., Wang, D., Bian, C., Ge, W., Chong, C.M.
- Source
- Full text @ Biomed. Pharmacother.

The effects of Ponatinib on the morphology of zebrafish larvae. (A) Survival curves of 1 dpf zebrafish larvae exposed to indicated concentrations of Ponatinib or 0.1 % DMSO (vehicle control) for 3 days (n=15). (B) Body length of 4 dpf zebrafish (n=7). Data are represented as mean ± SEM. **P < 0.01 and ***P < 0.005 vs. control group. (C) Representative images of Ponatinib-induced pericardial edema in 4 dpf zebrafish. (D) The pericardial edema rate in 15 fish/group batches. Data are represented as mean ± SEM. ***P < 0.005 vs. control group. (E) The pericardial edema area (n>15). Data are represented as mean ± SEM. ***P < 0.005 vs. control group. PHENOTYPE:
|

The effects of Ponatinib on heart function of zebrafish larvae. (A) 1 dpf Tg (cmlc2: GFP) transgenic zebrafish were treated with 0.1 % DMSO or indicated concentrations of Ponatinib for 3 days. The represented images of Ponatinib-induced abnormal heart in 4 dpf zebrafish larvae. (B) SV-BA distance of 4 dpf zebrafish (n=8). Data are represented as mean ± SEM. ***P < 0.005 vs. control group. (C) Atrial area of 4 dpf zebrafish (n=8). Data are represented as mean ± SEM. *P < 0.05 and ***P < 0.005 vs. control group. (D) Ventricular area of 4 dpf zebrafish (n=8). Data are represented as mean ± SEM. **P < 0.01 and ***P < 0.005 vs. control group. (E) Heart rate of 4 dpf zebrafish (n=10). Data are represented as mean ± SEM. ***P < 0.005 vs. control group. (F) Ventricular fractional shortening of 4 dpf zenrafish (n=10). Data are represented as mean ± SEM. *P < 0.05 and ***P < 0.005 vs. control group. (G) Representative images of apoptotic cells in the 4 dpf zebrafish heart as determined by TUNEL staining. PHENOTYPE:
|

Thrombosis in Ponatinib-treated zebrafish larvae. (A) 1 dpf Tg (gata1: dsRed) transgenic zebrafish larvae were treated with 0.1 % DMSO or indicated concentrations of Ponatinib for 3 days. The represented images of Ponatinib-induced blood flow stop in the tail of 4dp zebrafish larvae. PCV: Posterior caudal vein. (B) The incidences of blood flow stop in 15 fish/group batches. Data are represented as mean ± SEM. *P < 0.05 and ***P < 0.005 vs. control group. (C) The rate of the thrombus occurring in the zebrafish larvae was recorded. Data are presented as means ± SD (n = 3). *P < 0.05 and ***P < 0.005 vs. control group. (D) The represented images of Ponatinib-induced thrombus formation (the accumulation of erythrocytes) in 4 dpf zebrafish larvae detected by the o-dianisidine staining. (E) The areas of thrombus of 4 dpf zebrafish were measured by image J (n=8). Data are represented as means ± SEM. ***P < 0.005 vs. control group. PHENOTYPE:
|

The effects of Ponatinib on transcriptome in zebrafish larvae. (A) 1 dpf zebrafish larvae were treated with 0.1 % DMSO or 3 μM Ponatinib for 3 days. RNA sequencing was performed to identify the changes in gene expression. A volcano plot representing the expression level for each gene. Block dots represent no significant DEGs between control and Ponatinib groups. Red and blue dots represent up- and down-regulated genes, respectively. (B) The enriched gene sets based on GO pathways. (C) The enriched gene sets based on KEGG pathways. (D) Heat map representing 43 gene expression changes related to COX and MAPK signaling pathway. (E) 1 dpf zebrafish larvae were treated with 0.1 % DMSO or indicated concentrations of Ponatinib for 3 days. The mRNA levels of all L-type calcium channels-related genes in 4 dpf zebrafish were determined by RT-qPCR. Data are represented as mean ± SEM. *P < 0.05 and ***P < 0.005 vs. control group. |

The effects of anti-thrombotic drugs on Ponatinib-induced thrombosis in zebrafish larvae. (A) 1 dpf Tg (gata1: dsRed) transgenic zebrafish larvae were treated with 0.1 % DMSO or 10 μM Ponatinib or co-treated with 10 μM Ponatinib and 25 μg/ml Aspirin or 25 μg/ml Clopidogrel or 25 μg/ml Dipyridamole for 3 days. The represented images of the blood flow in different groups. (B) The rate of blood flow stops in 15 fish/group batches. Data are represented as mean ± SEM. ###P < 0.005 vs. control group; **P < 0.01 and ***P < 0.005 vs. Ponatinib group. (C) The represented images and (D) quantification of thrombus formation in different groups detected by the o-dianisidine staining (n=8). Data are represented as mean ± SEM. ###P < 0.005 versus control group; ***P < 0.005 vs. Ponatinib group. (E) The erythrocytes (red colour) in heart was detected by the o-dianisidine staining. The area in the red dashed line square was measured by Image J (n=8). Data are represented as mean ± SEM. ###P < 0.005 versus control group; ***P < 0.005 vs. Ponatinib group. PHENOTYPE:
|

A COX-1 inhibitor Aspirin reduced Ponatinib-induced death and cardiac dysfunction in zebrafish larvae. (A) Survival curves of 1 dpf zebrafish larvae were treated with 0.1 % DMSO or 10 μM Ponatinib or co-treated Aspirin at indicated concentrations and 10 μM Ponatinib for 3 days (n=15). Data are represented as mean ± SEM. ###P < 0.005 versus control group; ***P < 0.005 vs. Ponatinib group. (B) Body length of 4 dpf zebrafish (n=7). Data are represented as mean ± SEM. ###P < 0.005 versus control group; **P < 0.01 and ***P < 0.005 vs. Ponatinib group. (C) Heart rate of 4 dpf zebrafish (n=10). Data are represented as mean ± SEM. ###P < 0.005 versus control group; ***P < 0.005 vs. Ponatinib group. (D) 1 dpf Tg (cmlc2: GFP) transgenic zebrafish larvae were treated with 0.1 % DMSO or 10 μM Ponatinib or co-treated Aspirin at indicated concentrations and 10 μM Ponatinib for 3 days (n=10). The represented images of the heart in different groups. (E) The pericardial edema area and (F) SV-BA distance in different groups were quantified. Data are represented as mean ± SEM. ###P < 0.005 versus control group; ***P < 0.005 vs. Ponatinib group. (G) The mRNA levels of, cacna1c, cacn2d2a, cacna2d2b, and cacna3b in 4 dpf zebrafish were determined by RT-qPCR. Data are represented as mean ± SEM. ##P < 0.01 and ###P < 0.005 versus control group; **P < 0.01 and ***P < 0.005 vs. Ponatinib group. |
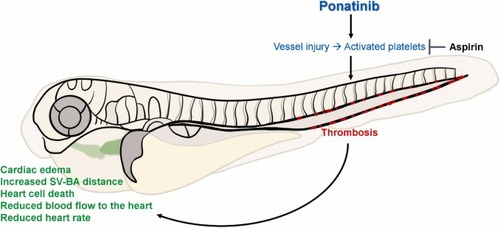
A proposed mechanism for the effects of Aspirin on Ponatinib-induced cardiovascular toxicity. |