
- Title
-
Live tracking of basal stem cells of the epidermis during growth, homeostasis and injury response in zebrafish
- Authors
- Liu, Z., Meng, Y., Ishikura, A., Kawakami, A.
- Source
- Full text @ Development
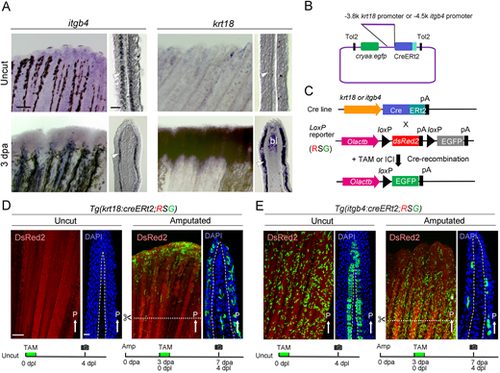
Generation of Cre Tg lines with itgb4 or krt18 promoters. (A) Whole-mount ISH analysis of itgb4 and krt18 expressions in adult zebrafish fin. dpa, days post amputation. Respective longitudinal sections are shown on the right side. itgb4 is expressed in the basal layer of amputated and uncut fin, whereas krt18 is only expressed in the regenerating fin. Arrowheads show the basal layer of the epidermis. Note that the ISH signal of krt18 is also seen in the blastema (bl). Scale bars: 100 µm (whole mount); 30 µm (section). (B) Diagram of the Tol2 transposon-based vector used to generate the Tgs. cryaa, crystalline alpha a promoter. (C) Scheme illustrating the Cre-mediated lineage tracking. The double Tgs of Cre-expressing line and the loxP reporter line, Tg(Olactb:loxP-dsred2-loxP-egfp) (RSG), were treated with tamoxifen (TAM) or fulvestrant (ICI) to induce the recombination at loxP sites. The resulting EGFP expression persists in all progeny cells. pA, polyadenylation signal sequence. (D,E) EGFP expression in amputated and uncut fins of Tg(krt18:creERt2) (D) and Tg(itgb4:creERt2) (E). EGFP expression is also seen in a fraction of mesenchymal cells within the fin ray of Tg(krt18:creERt2). TAM was added at 3 dpa (Amputated) and all images were taken at 4 days post labelling (dpl). Dotted line, amputation plane. Dashed line, basement membrane. Scale bars: 300 µm (left); 50 µm (right). White arrows indicate the posterior side (P). Experimental procedures are schematically shown below each image. |
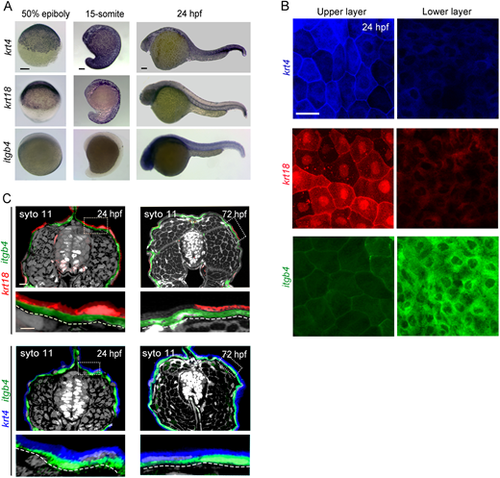
Epidermal cells become mosaic at 15-somite stage. (A) ISH analysis of krt4, krt18 and itgb4 expressions. krt4 was detected in all embryonic stages. krt18 was expressed in early embryonic stage, but the expression declined after the somite stage. itgb4 was only detected after 24 hpf. At the somite stage onward, epithelial cells have a mosaic expression of krt4 and krt18. Scale bars: 50 µm. (B) Confocal images of upper and lower layers of epithelial cells of Tg(krt4:tagBFP-nfsB), Tg(krt18:mcherry) or Tg(itgb4:mcherry) in the trunk region at 24 hpf. Scale bar: 20 µm. (C) Confocal images of the cross section of Tg(krt18:mcherry;itgb4:tagBFP-nfsB) (upper panels) and Tg(krt4:tagBFP-nfsB;itgb4:mcherry) (lower panels) in the middle trunk region at 24 hpf and 72 hpf. Fluorescence of krt4, krt18, itgb4 and SYTO11 are shown in blue, red, green and white pseudocolours, respectively. The expression of itgb4 is localised in the basal layer. Scale bar: 20 µm. Boxed areas (broken lines) are shown in the lower panels. Curved dashed lines indicate basement membrane. |
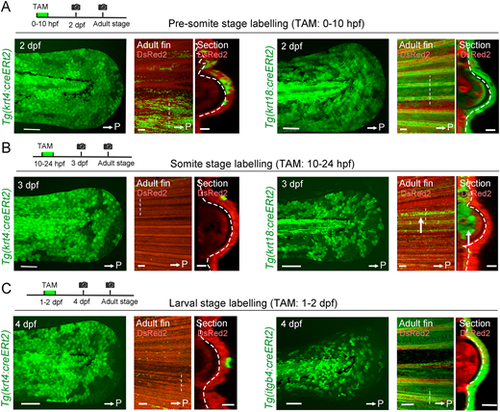
Fate segregation of basal cells from embryonic epithelial cells. (A) Tracking of epithelial cells that are krt4+ or krt18+ in the pre-somite stage. Tamoxifen (TAM) (1 µM) treatment was carried out between 0 and10 hpf. In both Tgs, progenies of EGFP-labelled cells were maintained in the adult fin epidermis including the basal cells and keratinocytes. (B) Tracking of epithelial cells that are krt4+ or krt18+ in the somite stage. EGFP+ cells were induced at 3 dpf (left). In contrast to A, progenies of labelled cells disappeared by the adult stage in both Tgs, except a few remaining surface keratinocytes. In krt18:cre-labelling, a group of mesenchymal cells that were maintained until the adult stage were observed (arrows). (C) Tracking of epithelial cells that are krt4+ or itgb4+ during 1-2 dpf. The progenies of itgb4+ cells contribute to the adult epidermis including the fins (left panels), whereas the progeny of krt4+ cells mostly disappeared by the adult stage (right panels). White arrows indicate the posterior side (P). Respective experimental procedures are schematically shown. Scale bars: 100 µm (2-4 dpf larva and adult fin); 50 µm (section). Straight dashed lines indicate the place of the optical section (right panels). Curved dashed lines indicate basement membrane. |
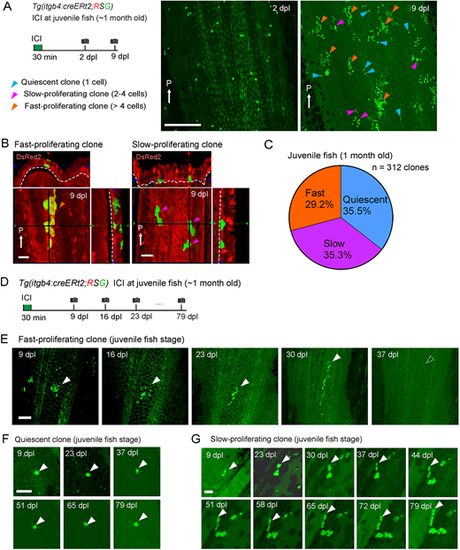
Tracking of the basal cell behaviour in juvenile fish. (A) Tracking of the itgb4:cre-labelled cells at a single cell resolution in the 1-month-old juvenile fish fin. Fish were treated with 0.5 µM ICI to sparsely label the itgb4+ basal cells. dpl, days post labelling. The same region of the tissue was imaged in a 1-week time window (2-9 dpl). The EGFP+ cells displayed three proliferation patterns: quiescent (1 cell, blue arrowheads), slow-proliferating (2-4 cells, purple arrowheads) and fast-proliferating (>4 cells, orange arrowheads). White arrows indicate the posterior end (P) of fins. Experimental procedure is shown on the left. Scale bar: 200 µm. (B) Confocal images and their optical sections of fast-proliferating and slow-proliferating clones in the juvenile fish fin. Note that the fast-proliferating clone only contains non-basal cells, whereas the slow-proliferating clone only contains the basal cells. White arrows indicate the posterior side (P). Scale bars: 20 µm. (C) Ratios of clones with respective proliferation patterns (n=312 clones from five juvenile zebrafish). (D) Experimental scheme of long-term tracking of clonal cell fates. Time-lapse images were taken at intervals of 7 days. (E) Representative image of fast-proliferating clones. They quickly proliferated, but finally disappeared in the long run, suggesting that such clones did not contain the basal stem cells. Scale bar: 100 µm. (F) Representative image of quiescent clone. These clones kept quiescent for more than 79 dpl. Scale bar: 50 µm. (G) Representative image of slow-proliferating clone, which slowly expanded the clone size and maintained for more than 79 days. Scale bar: 30 µm. White arrowheads indicate examples of tracked clones. |
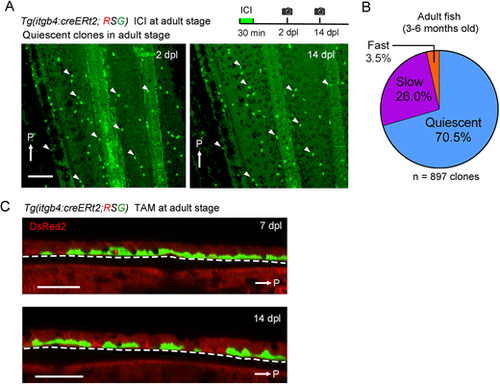
Tracking of the basal cell behaviour in adult fish. (A) Tracking of the itgb4:cre-labelled cells at a single cell resolution in adult fish fin (3 months old). The images were taken from the same fin region of the fish. White arrows indicate the posterior side (P). Experimental procedure is shown at the top. Arrowheads indicate representative corresponding cells between these panels. Most of the labelled clones were quiescent in a time window between 2-14 dpl. Scale bar: 200 µm. (B) Ratios of clones with respective proliferation patterns in the adult fin epidermis (n=897 clones from six adult zebrafish). (C) Confocal optical sections of itgb4:cre-labelled cells in the adult fin epidermis. Basal cells were labelled with tamoxifen (TAM) treatment. The basal cells did not produce the non-basal cells. Scale bar: 50 µm. Dashed lines indicate basement membrane. |
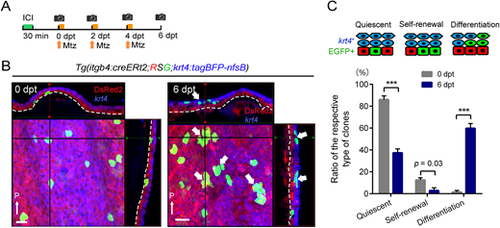
Induction of basal cell differentiation by non-basal keratinocyte injury. (A) Experimental procedure of basal cell labelling and krt4+ cell injury. Mtz, metronidazole treatment. (B) Confocal images and their optical sections of the EGFP-labelled basal cells in the adult fin before (left panel) and after (6 dpt, right panel) non-basal cell injury. Thin white arrows indicate posterior side (P). Dashed lines indicate basement membrane. After injury of krt4+ cells, the basal cells often became the krt4+ keratinocytes at 6 dpt. Note that such clones did not contain the basal cells, indicating that the basal cells differentiated into non-basal cells (thick white arrows). Scale bar: 20 µm. (C) Quantification of the basal cell reactions in response to non-basal cell injury. The number of clones was counted on confocal images (n=156 clones at 0 dpt, n=276 clones at 6 dpt from four adult fish fins). Respective proliferative patterns are schematically shown above the graph. Error bars denote mean±s.e.m. ***P<0.001 (paired two-tailed Student's t-test). dpt, days post treatment. |
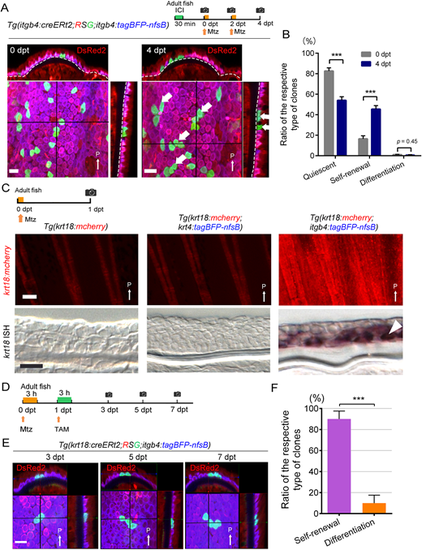
Induction of basal cell self-renewal by basal cell injury. (A) Confocal images and their optical sections of the EGFP-labelled basal cells in the adult fin before (left panel) and after (4 dpt, right panel) basal cell injury. Experimental procedure is shown at the top. Dashed lines indicate basement membrane. After the injury of itgb4+ basal cells, many of the labelled basal cells stayed in the basal layer. They either remained quiescent or slowly proliferated to self-renew the basal cells (thick white arrows). Scale bar: 20 µm. (B) Quantification of A. The number of clones was counted on confocal images (n=460 clones at 0 dpt, n=445 clones at 4 dpt from four adult fish fins). Error bars denote mean±s.e.m. ***P<0.001 (paired two-tailed Student's t-test). (C) Induction of krt18 expression after basal cell injury but not by the keratinocyte injury as revealed by Tg(krt18:mcherry) (upper panels) and ISH analyses (longitudinal fin sections, lower panels). Experimental procedure is shown at the top. Mtz, metronidazole treatment. All images were obtained from 1 dpt fin. krt18 expression was only induced by the basal cell injury. Scale bars: 100 µm (upper panels); 20 µm (lower panels). Arrowhead indicates krt18+ cells in the basal layer. (D) Experimental procedure of basal cell injury and the following krt18+ cell labelling. (E) Tracking of krt18-expressed cells in the fin that were induced by basal cell injury. Confocal 3D images were taken at 3, 5, 7 dpt from the same location of the caudal fin. Scale bar: 20 µm. (F) Relative ratio of the type of clones that are labelled by krt18:cre. The number of clones, either self-renewal or differentiation, was counted on the confocal images at 7 dpt (n=75 clones from five fish fins). Most of the labelled cells underwent self-renewal to replenish the itgb4+ basal cells. Error bars denote mean±s.e.m. ***P<0.001 (unpaired two-tailed Student's t-test). Thin white arrows indicate posterior side (P). dpt, days post treatment. |