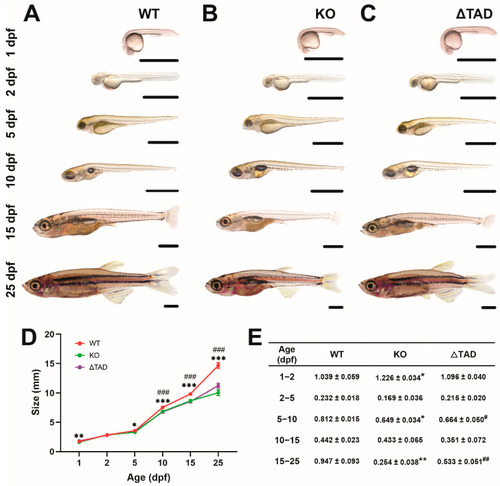
Effect of Stat3 mutations on size and growth. Representative images of Stat3 wildtype (WT: A), knockout (KO: B), and transactivation domain truncation (ΔTAD: C) mutants at the indicated times postfertilization with quantitation of length (D) and calculated growth rate (E) at the given time, presented as mean with the standard error of the mean (SEM) and statistical significance indicated between WT and KO (*** p < 0.001, ** p < 0.01, * p < 0.05) as well as WT and ΔTAD (### p < 0.001, ## p < 0.01, # p < 0.05).

Deformity and mortality of Stat3 mutants. Representative images of Stat3 wildtype (WT: A), knockout (KO: B), and transactivation domain truncation (ΔTAD: C) mutants presenting with deformities at the indicated time points. The incidence of deformity (D) and relative survival (E) in these mutants compared to wildtype (WT) individuals are presented as Kaplan–Meier plots, with statistical significance indicated between WT and KO (*** p < 0.001) as well as WT and ΔTAD (### p < 0.001).

Effects of Stat3 mutants on spine formation. Representative images of calcein-stained Stat3 wildtype (WT: A), knockout (KO: B), and transactivation domain truncation (ΔTAD: C) mutants at the indicated timepoints, with yellow arrowheads indicating skeletal disruption.

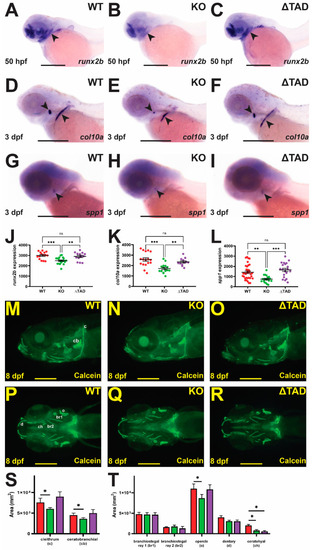
Effect of Stat3 mutations on bone formation. Representative images of Stat3 wildtype (WT: A,D,G,M,P), knockout (KO: B,E,H,N,Q), and transactivation domain truncation (ΔTAD: C,F,I,O,R) mutant embryos subjected to WISH at 50 hpf with runx2b (AC) and at 3 dpf with col10a (DF) or spp1 (GI) in lateral view as indicated with black arrowheads, or at 8 dpf with calcein staining (lateral: MO; ventral: PR), with scale bars representing 200 μm. Quantification of area of staining for runx2b (J), col10a (K), and spp1 (L), showing individual values for each embryo and of specific bones (S,T), with mean, SEM, and statistical significance indicated (*** p < 0.001, ** p < 0.01, * p < 0.05, ns: not significant). Abbreviations: br1/2: branchiostegal ray 1/2; c: cleithrum; cb: ceratobranchial; ch: ceratohyal; d: dentary; o: opercula.

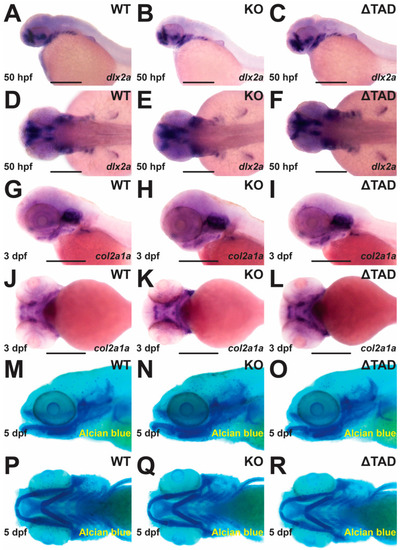
Effect of Stat3 mutations on embryonic cartilage formation. Representative images of STAT3 wildtype (WT: A,D,G,J,M,P), knockout (KO: B,E,H,K,N,Q), and transactivation domain truncation (ΔTAD: C,F,I,L,O,R) mutant embryos subjected to WISH at 50 hpf with dlx2a (lateral: AC; ventral: DF) and at 72 hpf with col2a1a (lateral: GI; ventral: JL), or at 5 dpf to Alcian blue staining (lateral: MO; ventral: PR) with scale bars representing 200 μm.

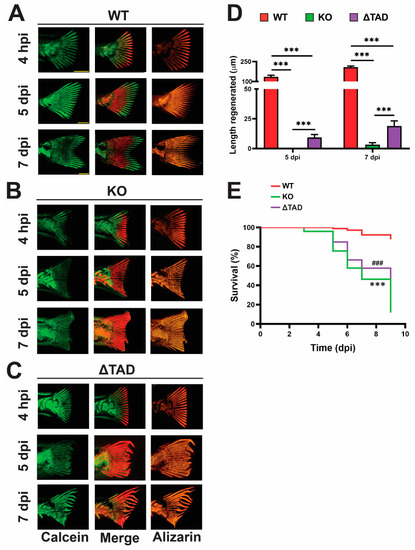
Effect of Stat3 mutations on fin regeneration. Representative images of wildtype (WT: A), knockout (KO: B), and transactivation domain truncation (ΔTAD: C) zebrafish subjected to staining with calcein and Alizarin red at the indicated timepoints, showing staining with each separately and then overlaid (Merge), with scale bars representing 1 mm. Quantification of caudal fin regeneration as the length from the amputation site to the newly formed fin ray tip (D) showing mean with SEM and statistical significance indicated (*** p < 0.001). Relative survival following amputation (E), presented as a Kaplan–Meier plot with statistical significance indicated between WT and KO (*** p < 0.001) as well as WT and ΔTAD (### p < 0.001).

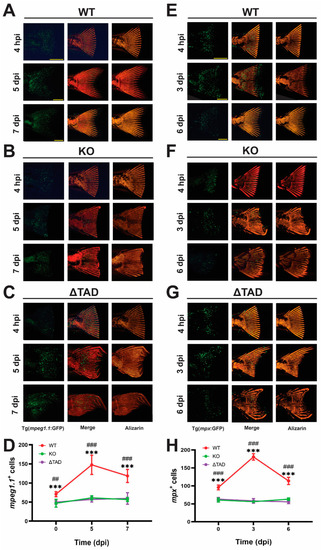
Effect of Stat3 mutations on innate immune response to amputation. Representative caudal fin of wildtype (WT: A,E), knockout (KO: B,F), and transactivation domain truncation (ΔTAD: C,G) zebrafish larvae on either the Tg(mpeg1.1:GFP) (AC) or Tg(mpx:GFP) (EG) backgrounds stained with Alizarin red (Alizarin) at the timepoints indicated, showing GFP fluoresce and Alizarin staining separately and then overlaid (Merge), with scale bars representing 1 mm. Quantitation of mpeg1.1+ cells (D) and mpx+ cells (H) at the indicated times postamputation with mean and SEM, showing statistical significance between WT and KO (*** p < 0.001) as well as WT and ΔTAD (### p < 0.001, ## p < 0.01).

Acknowledgments
This image is the copyrighted work of the attributed author or publisher, and ZFIN has permission only to display this image to its users. Additional permissions should be obtained from the applicable author or publisher of the image. Full text @ Int. J. Mol. Sci.