FIGURE SUMMARY
Title

Constitutively active CaMKII Drives B lineage acute lymphoblastic leukemia/lymphoma in tp53 mutant zebrafish

Authors
Rothschild, S.C., Lai, G., Tombes, R.M., Clements, W.K.
Source
Full text @ PLoS Genet.

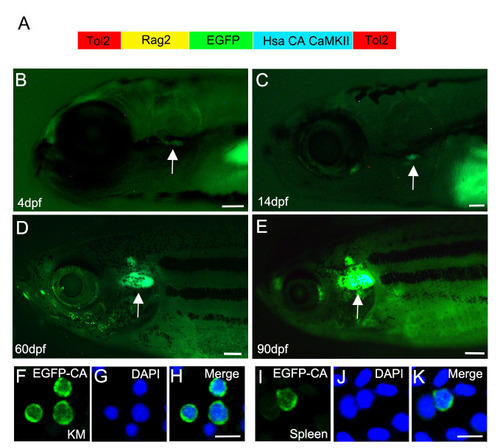
Transgenic expression of human (Hsa) constitutively active (T287D, CA) EGFP-CA-CaMKII in lymphocytes of zebrafish.

(A) Diagram of the rag2:EGFP-CA-CaMKII construct. (B, C, D, E arrows) Stable rag2:EGFP-CA-CaMKII fish express EGFP in the thymus at 4 dpf, 14 dpf, 60 dpf, and 90 dpf. (F-K) Rag2:EGFP-CA-CaMKII is expressed in both the cytosol and nucleus of (F-H) kidney marrow (KM) and (I-K) spleen lymphocytes counterstained with DAPI at six-months of age. Scale bars: 100 μm in B and C, 400 μm in D and E, and 10 μm in H and K.

Rag2:EGFP-CA-CaMKII is expressed in thymic T cells and immature kidney marrow B lymphocytes.

(A-F) Rag2:EGFP-CA-CaMKII colocalizes with rag2:DsRed in the thymus at (A-C, confocal images A’-C’) 4 dpf and (D-F) 5 mpf but does not colocalize in the skin at (skin magnified D’-F’) 5 mpf fish. (G) FACS analysis of kidney marrow cells from rag2:EGFP-CA-CaMKII; rag2:DsRed fish at 3 mpf. Gated populations: erythrocytes (red gate), lymphocytes (green gate), precursors (pink gate), and myelomonocytes (blue gate). (H) The EGFP and DsRed positive population for each sample is predominantly found in the lymphocyte gate, as expected. (I) Lymphocytes were further defined as double negative (DN), single positive EGFP (gSP) single positive DsRed (rSP), and double positive (DP). Rag2:EGFP-CA-CaMKII; rag2:DsRed kidney marrow lymphocyte cells were sorted at (J,K) 6 mpf and (L,M) 12 mpf then analyzed for B cell (rag2, rag1, igiv1s1, cd79a, ighm-C, ight-C, igic1s1) and T cell (lck), marker gene expression using RT-PCR (K,M). Ef1a served as a control. Scale bars: 100 μm in C and 500 μm in F.

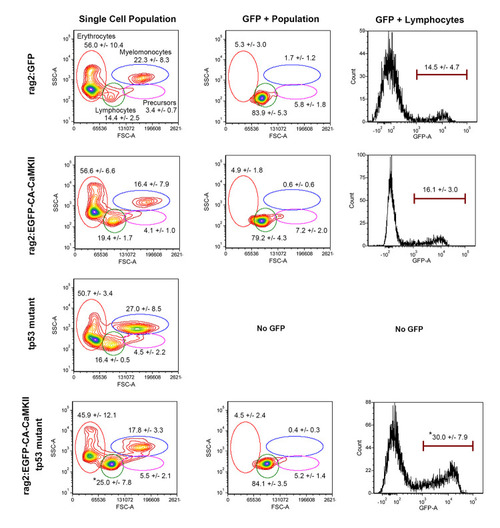
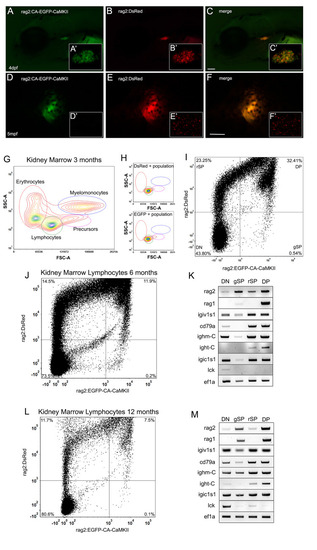
The lymphocyte population is expanded in the kidney marrow of rag2:EGFP-CA-CaMKII; tp53 mutant fish.

FACS analysis of the kidney of six-month old rag2:GFP (n = 4), rag2:EGFP-CA-CaMKII transgenic (n = 5), tp53 mutant (n = 2), and rag2:EGFP-CA-CaMKII; tp53 mutant fish (n = 5) without overt illness. Gated populations: erythrocytes (red), lymphocytes (green), precursors (pink), and myelomonocytes (blue). Populations of cells within each gate are described as a percentage of total live cells. The GFP positive population for each sample is predominantly found in the lymphocyte gate, as expected. The percentages of GFP positive cells in the lymphocyte gate are represented in the histograms. P values were calculated using one-way ANOVA followed by Tukey HSD. * p<0.05.

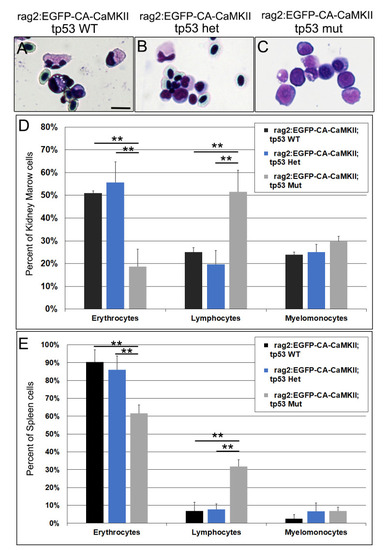
Lymphocytes are significantly expanded in the kidney marrow and spleen of rag2:EGFP-CA-CaMKII; tp53 mutant fish.

Lineage distributions as determined by cell morphology in the (A-D) kidney marrow and (E) spleen of 9–12 month old fish segregated into rag2:EGFP-CA-CaMKII on a wild type (black, n = 3), tp53 heterozygous (blue, n = 3), or tp53 mutant background (gray, n = 4). Cell populations were identified from eight to ten images of HEMA3 stained blood smears per fish. P values were calculated using one-way ANOVA followed by Tukey HSD. ** p<0.01. Scale bar is 10 μm in A.

Rag2:EGFP-CA-CaMKII; tp53 mutant fish develop acute lymphoblastic leukemia/lymphoma.

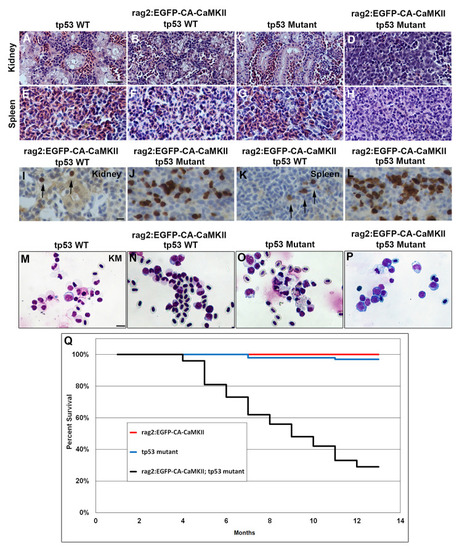
Hematoxylin and eosin stained sections of the (A-D) head kidney and (E-H) spleen of nine month old (A, E) wild type, (B, F) rag2:EGFP-CA-CaMKII transgenic, (C, G) tp53 mutant, and (D, H) rag2:EGFP-CA-CaMKII; tp53 mutant fish. (D, H) An increase in lymphoblasts is observed in the kidney and spleen of rag2:EGFP-CA-CaMKII; tp53 mutant fish. (I-L) Anti-EGFP immunohistochemistry indicates EGFP positive lymphocytes are increased in the (J) kidney marrow and (L) spleen of leukemic fish compared to (I, K) rag2:EGFP-CA-CaMKII wild type fish. Kidney marrow (KM) cytospins of (M) wild type, (N) rag2:EGFP-CA-CaMKII transgenic, (O) tp53 mutant, and (P) rag2:EGFP-CA-CaMKII; tp53 mutant were HEMA3 stained. (Q) Four cohorts of fish were assessed for survival during the first year. p<0.0001 comparing rag2:EGFP-CA-CaMKII; tp53 wild type fish to rag2:EGFP-CA-CaMKII; tp53 mutants and tp53 mutants to rag2:EGFP-CA-CaMKII; tp53 mutants for survival using the Log-rank (Mantel-Cox) test. A statistically significant reduction in survival of rag2:EGFP-CA-CaMKII; tp53 fish was evident, p<0.01. Scale bars: 40 μm in A and 10 μm in I and Q.

Kidney marrow blasts expressing rag2:EGFP-CA-CaMKII are B lineage and have reduced productive IgH VDJ rearrangements.

EGFP positive and negative lymphoid cells from the kidney marrow were sorted from six-nine month old adult rag2:EGFP-CA-CaMKII transgenics on a wild-type or tp53 mutant background and the expression of B (rag2, igiv1s1, cd79a, ighm-C, igt-C, pax5, ikzf1) and T (lck, tcrd-C) lineage markers was determined by RT-PCR. Ef1a served as control (A). Arrangement of the zebrafish IgH locus and schematic of IgHM and IgHT VDJ assembly (B). Genomic analysis of VDJ recombined (red arrow) IgVH1-Jm, IgVH2-Jm, IgVH3-Jm, IgVH1-Jt, IgVH2-Jt, and IgVH3-Jt in rag2:DsRed, rag2:EGFP-CA-CaMKII, tp53 mutant, and rag2:EGFP-CA-CaMKII; tp53 mutant kidney marrow lymphocytes using semi-nested PCR. Ef1a served as a control (C). Analysis of productive IgHM (D) and IgHT (E) rearrangements in genomic DNA from rag2:EGFP-CA-CaMKII, tp53 mutant, and rag2:EGFP-CA-CaMKII; tp53 mutant kidney marrow lymphocytes. P values were calculated using Fisher’s exact test. * p<0.05, ** p<0.01.

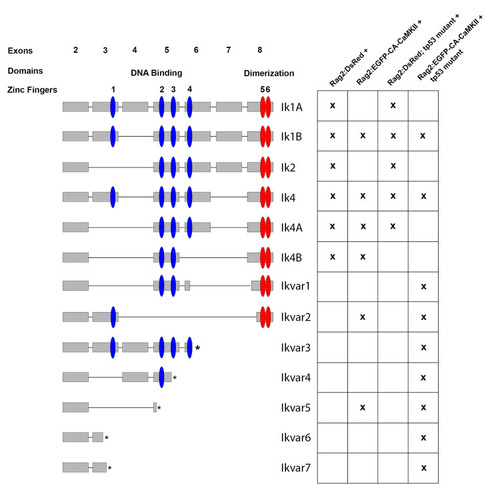
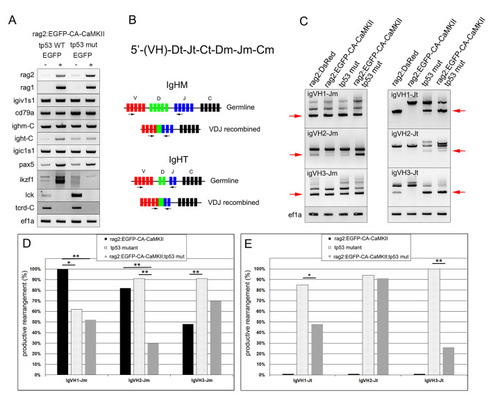
Izf1 splicing is altered in rag2:EGFP-CA-CaMKII;tp53 mutant B cells.

Zebrafish ikzf1 was PCR amplified, cloned, and sequenced from the indicated cell fractions. Zebrafish izf1 is encoded by eight alternatively spliced exons with four zinc finger DNA binding domains (blue) and two zinc finger dimerization domains (red). Cell fractions included rag2:DsRed positive, rag2:DsRed;tp53 mutant positive, rag2:EGFP-CA-CaMKII positive, and rag2:EGFP-CA-CaMKII;tp53 mutant positive B cells. The “x” indicates expression of the particular ikzf1 splice variant in fluorescently sorted kidney marrow B cells. Ikvar3-7 resulted from frameshifts that induced premature stop codons (S4 Table).

Pharmacological inhibition of CaMKII induces cell death in human pre-B ALL cells.

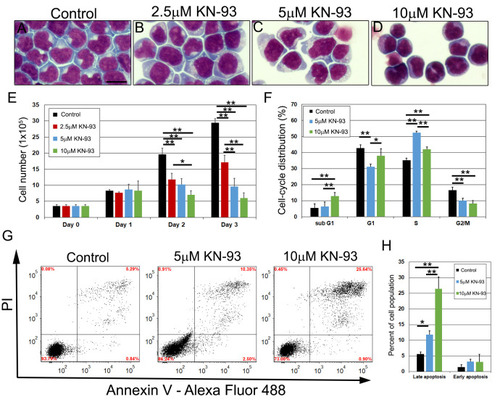
HEMA3 stained NALM6 cells treated with 2.5μM, 5μM, and 10μM KN-93 at 48h (A-D). NALM6 growth curves were assessed at 24-hour intervals until 72h after KN-93 treatment. (E, n = 3). Cell cycle distribution was assessed after PI staining in control, 5μM, and 10μM KN-93 treated NALM6 cells at 48h (F, n = 5). NALM6 cells were stained with Annexin V and PI after KN-93 treatment and analyzed using flow cytometry at 48h. The lower left quadrant are cells that are negative for Annexin V and PI, the upper left quadrant is PI positive only indicative of necrosis, the upper right quadrant identifies cells that are positive for both Annexin V and PI indicating late apoptosis, and the bottom right quadrant shows cells that are Annexin V positive, which indicates early stages of apoptosis (G). The bar graph shows the percent of cells that are in early and late stage of apoptosis from four experiments (H). P values were calculated using one-way ANOVA followed by Tukey HSD. * p<0.05 and ** P<0.01. Scale bar: 20 μm in A.

Acknowledgments
This image is the copyrighted work of the attributed author or publisher, and ZFIN has permission only to display this image to its users. Additional permissions should be obtained from the applicable author or publisher of the image. Full text @ PLoS Genet.