
Fig 2
- ID
- ZDB-IMAGE-240105-65
- Publication
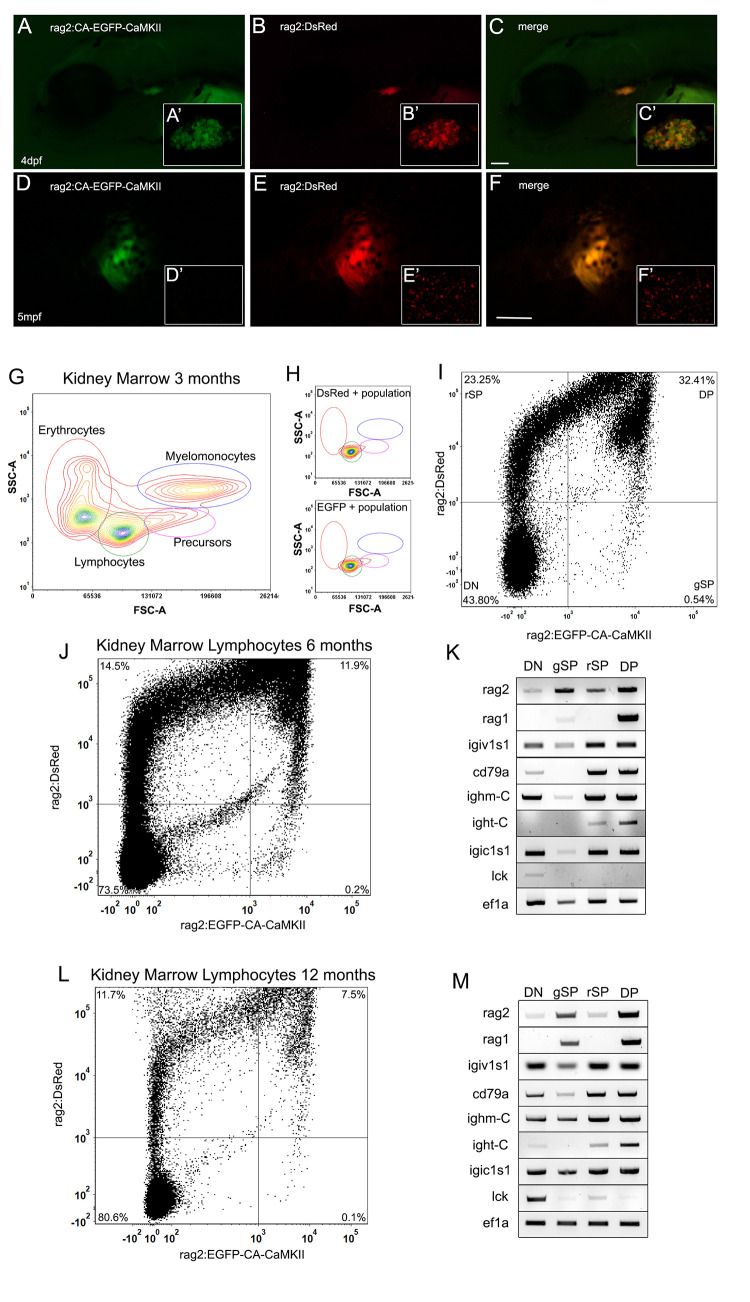
- Rothschild et al., 2023 - Constitutively active CaMKII Drives B lineage acute lymphoblastic leukemia/lymphoma in tp53 mutant zebrafish
- All Figures
- Figures for Rothschild et al., 2023
|
Fig 2
(A-F)