FIGURE SUMMARY
Title

CRISPR/Cas9-mediated nexilin deficiency interferes with cardiac contractile function in zebrafish in vivo

Authors
Hofeichner, J., Gahr, B.M., Huber, M., Boos, A., Rottbauer, W., Just, S.
Source
Full text @ Sci. Rep.

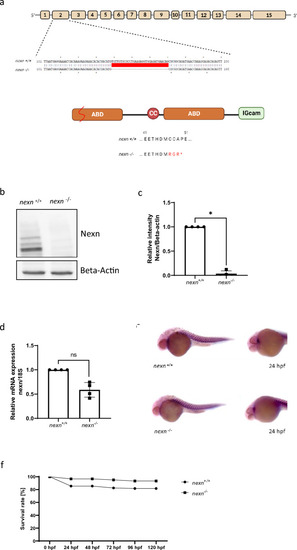
Generation of zebrafish nexn knockout by CRISPR/Cas9 gene editing. (a) Structure of the nexn gene and protein. Nexn consists of a central coiled coil domain (CC) flanked by two actin-binding domains (ABD) and a C-terminal immunoglobulin superfamily class (IGcam). The deletion of 32 nucleotides in exon 2 by CRISPR/Cas9 editing leads to a frameshift and premature stop codon, and thereby to a termination of the Nexn translation after 49 amino acids within the first actin-binding domain. (b,c) Immunoblot and quantification of protein lysates of nexn−/− embryos showing reduced Nexn protein levels compared to nexn+/+ embryos at 72 hpf (N = 4, mean ± SD, p < 0.0286 using Wilcoxon test); original blot shown in Supplementary Fig. S1. (d) Quantitative real-time PCR of nexn−/− embryos showing similar nexn mRNA levels compared to nexn+/+ embryos at 72 hpf (N = 4, mean ± SD, p = 0.149 using Wilcoxon test). (e) in situ hybridization shows nexn expression in heart and skeletal muscle at a similar level in nexn−/− and nexn+/+ embryos at 24 hpf (N = 3, n = 15). (f) nexn+/+ and nexn−/− embryos do not show differences regarding survival rate at any developmental stage (N = 3 with a total number of 87 and 62 embryos, respectively, mean). ns not significant, *p < 0.05.

nexn knockout does not lead to severe skeletal muscle deficits. (a) Brightfield and birefringence images do not reveal phenotypical differences between nexn+/+ and nexn−/− embryos at 72 hpf. (b) Percentage of embryos showing phenotypical abnormalities does not differ between nexn+/+ and nexn−/− embryos at 48, 72 or 120 hpf (N = 3, mean ± SD, 48 hpf: p > 0.9999, 72 hpf: p = 0.6000, 120 hpf: p > 0.9999 using Mann–Whitney test). (c) Densitometric quantification of birefringence signals of nexn−/− and nexn+/+ embryos reveals significant differences at 120 (N = 3, n = 15, mean ± SD, p < 0.0001 using two-tailed t-test) but not 48 or 72 hpf (N = 3, n = 14/15, mean ± SD, 48 hpf: p = 0.1301, 72 hpf: p = 0.1201 using two-tailed t-test). (d) Immunostaining of nexn+/+ and nexn−/− embryos at 48, 72 and 120 hpf against Titin does not show muscle disruption. Scale bar (1 µm) refers to all images. ns not significant, ****p < 0.0001. Exact values (mean ± SD) are shown in Supplementary Table 1.

nexn knockout causes reduced cardiac function in zebrafish. (a) nexn+/+ and nexn−/− embryos do not show differences regarding responsiveness to mechanical stimuli at any developmental stage (N = 3, mean ± SD, p > 0.9999 for all using Mann–Whitney test). (b) nexn−/− embryos showing increased velocity at 48 hpf (N = 3, n = 15, mean ± SD, p = 0.0017 using two-tailed t-test) but not at later time points (N = 3, n = 14/15, mean ± SD, 72 hpf: p = 0.8709, 120 hpf: p = 0.3610 using two-tailed t-test). (c) Acceleration is at a similar level in nexn+/+ and nexn−/− embryos at 48, 72 and 120 hpf (N = 3, n = 14/15, mean ± SD, 48 hpf: p = 0.2121, 72 hpf: p = 0.9312, 120 hpf: p = 0.7324 using two-tailed t-test). (d) Heart rate was increased in nexn−/− embryos at 48 hpf (N = 3, n = 15, mean ± SD, p = 0.0404 using two-tailed t-test) but at a similar level as in nexn+/+ embryos at 72 and 120 hpf (N = 3, n = 15, mean ± SD, 72 hpf: p = 0.6927, p = 0.2300 using two-tailed t-test). (e) Whereas enddiastolic ventricular diameter was significantly decreased in nexn−/− embryos at 48 hpf (N = 3, n = 15, mean ± SD, p = 0.0350 using two-tailed t-test), it was not affected at 72 or 120 hpf (N = 3, n = 15, mean ± SD, 72 hpf: p = 0.6099, 120 hpf: p = 0.8075 using two-tailed t-test). (f) Analysis of ventricular fractional shortening does not show altered heart contractility in nexn−/− at 48 hpf (N = 3, n = 15, mean ± SD, p = 0.2315 using two-tailed t-test) but reduced contractility at 72 and 120 hpf (N = 3, n = 15, mean ± SD, 72 hpf: p = 0.0300, 120 hpf: p = 0.0141 using two-tailed t-test). (g) MF20/S46 staining shows properly differentiated ventricle and atrium in nexn−/− and nexn+/+ embryos at 72 hpf. Scale bar (20 µM) refers to both images. FS fractional shortening, ns not significant, *p < 0.05, **p < 0.01. Exact values (mean ± SD) are shown in Supplementary Table 1.

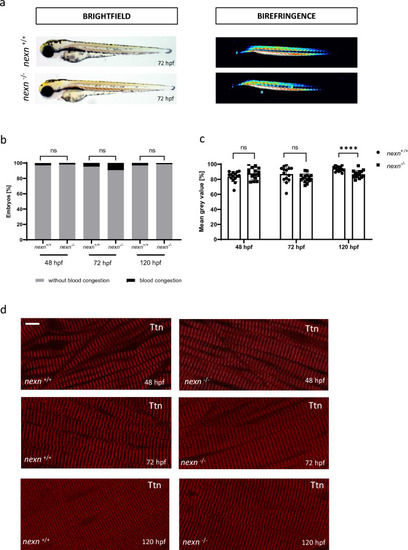
Increased muscular workload causes skeletal muscle disruption in later developmental stages of nexn knockout embryos. (a) Brightfield and birefringence images do not reveal phenotypical differences between nexn+/+ and nexn−/− embryos at 72 hpf. (b) Percentage of embryos showing phenotypical abnormalities does not differ between nexn+/+ and nexn−/− embryos at 48, 72 or 120 hpf (N = 3, mean ± SD, 48 hpf: p > 0.9999, 72 hpf: p = 0.8000, 120 hpf: p > 0.9999 using Mann–Whitney test). (c) Densitometric quantification of birefringence signals of nexn−/− and nexn+/+ embryos after stress reveals significant differences at 120 (N = 3, n = 15, mean ± SD, p < 0.0046 using two-tailed t-test) but not 48 or 72 hpf (N = 3, n = 14/15, mean ± SD, 48 hpf: p = 0.6516, 72 hpf: p = 0.2193 using two-tailed t-test). (d) Immunostaining of nexn+/+ and nexn−/− embryos after stress against Titin does not show altered muscle fibers at 48 and 72 hpf but severe muscle disruption in cranial regions (location shown in schematic illustration; created with biorender.com) at 120 hpf. Scale bar (1 µm) refers to all images. ns not significant, **p < 0.01. Exact values (mean ± SD) are shown in Supplementary Table 1.

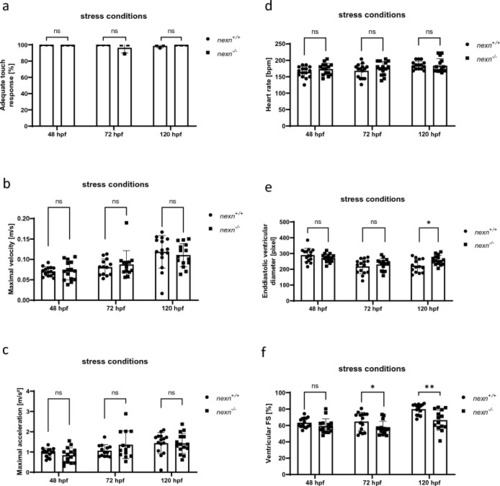
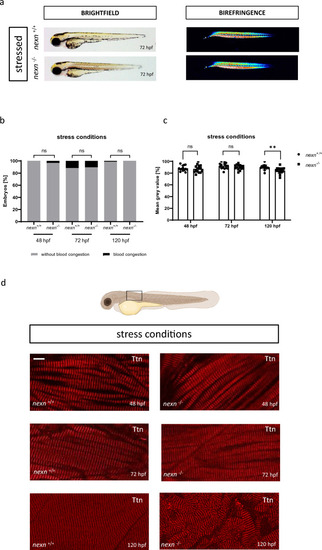
Increased muscular workload does not lead to aggravated cardiac dysfunction in nexn knockout zebrafish. (a) nexn+/+ and nexn−/− embryos do not show significant differences regarding responsiveness to mechanical stimuli at 48, 72 or 120 hpf (N = 3, mean ± SD, p > 0.9999 for all using Mann–Whitney test). (b) Maximal velocity was not affected at any developmental stage after increasing workload (N = 3, n = 15, mean ± SD, 48 hpf: p = 0.7875, 72 hpf: p = 0.5428, 120 hpf: p = 0.5202 using two-tailed t-test). (c) Maximal acceleration is at a similar level in nexn+/+ and nexn−/− embryos at 48, 72 and 120 hpf (N = 3, n = 15, mean ± SD, 48 hpf: p = 0.2460, 72 hpf: p = 0.1754, 120 hpf: p = 0.9284 using two-tailed t-test). (d) Heart rate of nexn−/− embryos was at a similar level as in nexn+/+ embryos at 48, 72 and 120 hpf (N = 3, n = 15, mean ± SD, 48 hpf: p = 0.1738, 72 hpf: p = 0.3121, 120 hpf: p = 0.8520 using two-tailed t-test). (e) Increased workload does not affect enddiastolic ventricular diameter at 48 and 72 hpf (N = 3, n = 15, mean ± SD, 48 hpf: p = 0.1807, 72 hpf: p = 0.4152 using two-tailed t-test) but leads to increased enddiastolic diameter at 120 hpf (N = 3, n = 15, mean ± SD, p = 0.0017 using two-tailed t-test). (f) Analysis of ventricular fractional shortening does not show altered heart contractility in nexn−/− compared to nexn+/+ embryos at 48 hpf (N = 3, n = 15, mean ± SD, p = 0.1538 using two-tailed t-test) but reduced fractional shortening at 72 and 120 hpf (N = 3, n = 15, mean ± SD, 72 hpf: p = 0.0379, 120 hpf: p = 0.0020 using two-tailed t-test). FS fractional shortening, ns not significant, *p < 0.05, **p < 0.01. Exact values (mean ± SD) are shown in Supplementary Table 1.

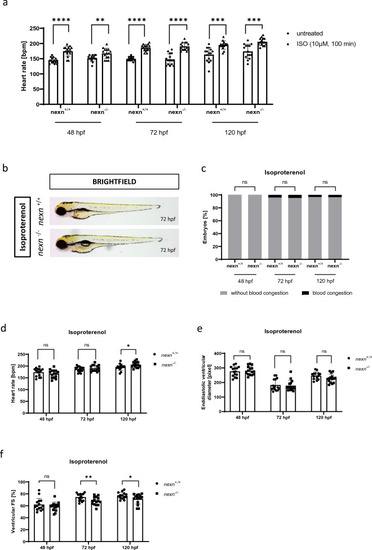
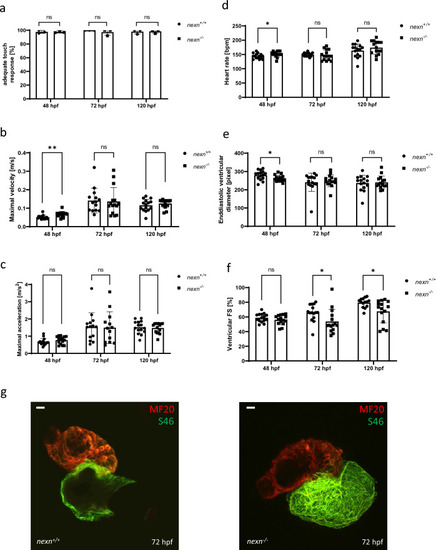
Increasing heart rate does not cause severe changes in cardiac functionality. (a) Isoproterenol treatment increases heart rate in nexn+/+ and nexn−/− embryos at all developmental stages (N = 3, n = 14/15, mean ± SD, 48 hpf nexn+/+: p < 0.0001, 48 hpf nexn−/−: p = 0.0085, 72 hpf nexn+/+: p < 0.0001, 72 hpf nexn−/−: p < 0.0001, 120 hpf nexn+/+: p = 0.0002, 120 hpf nexn−/−: p = 0.0001 using two-tailed t-test). (b) Brightfield images do not reveal phenotypical differences between nexn+/+ and nexn−/− embryos at 72 hpf. (c) Percentage of embryos showing phenotypical abnormalities does not differ between nexn+/+ and nexn−/− embryos at 48, 72 or 120 hpf (N = 3, mean ± SD, p > 0.9999 for all using Mann–Whitney test). (d) Heart rate of nexn−/− embryos is at a similar level as in nexn+/+ embryos at 48, and 72 hpf but increased at 120 hpf (N = 3, n = 15, mean ± SD, 48 hpf: p = 0.3112, 72 hpf: p = 0.3690, 120 hpf: p = 0.0350 using two-tailed t-test). (e) Increased heart rate does not affect enddiastolic ventricular diameter at 48, 72 and 120 hpf (N = 3, n = 15, mean ± SD, 48 hpf: p > 0.9999, 72 hpf: p = 0.7588, 120 hpf: p = 0.0701 using two-tailed t-test). (f) Analysis of ventricular fractional shortening does not show altered heart contractility in nexn−/− compared to nexn+/+ embryos at 48 hpf (N = 3, n = 15, mean ± SD, p = 0.3284 using two-tailed t-test) but reduced fractional shortening at 72 and 120 hpf (N = 3, n = 15, mean ± SD, 72 hpf: p = 0.0099, 120 hpf: p = 0.0498 using two-tailed t-test). FS fractional shortening, ns not significant, *p < 0.05, **p < 0.01. Exact values (mean ± SD) are shown in Supplementary Table 1.

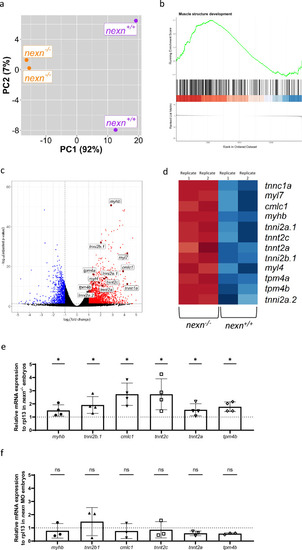
Nexn deficiency leads to upregulation of several genes encoding for sarcomeric proteins. (a) Principal component analysis (PCA) plot showing nexn+/+ and nexn−/− embryos (72 hpf) being clearly separated by PC1 (N = 2, n = 25). (b) Gene set enrichment analysis of the Gene Ontology term “muscle structure development” showing an overrepresentation of upregulated genes in nexn−/− embryos (normalized ES = 1.84; adjusted p = 1.14E−07). (c) Volcano plot of differentially expressed genes in nexn−/− compared to nexn+/+ embryos. Upregulated genes shown in red and downregulated genes shown in blue (adjusted p-value < 0.05 and |log2(FC)| > 0.5). Selected genes are labeled. (d) Heatmap showing selected genes of interest with clear difference regarding expression between nexn+/+ and nexn−/− embryos. High read counts shown in red and low read counts in blue. (e) Quantitative real-time PCR showing significantly increased myhb, tnni2b.1, cmlc1, tnnt2c, tnnt2c, tnnt2a and tpm4b transcript levels in nexn−/− compared to nexn+/+ embryos at 72 hpf. (f) Quantitative real-time PCR showing unaltered levels of myhb, tnni2b.1, cmlc1, tnnt2c, tnnt2c, tnnt2a and tpm4b in nexn MO-injected embryos compared to Ctrl MO-injected embryos at 72 hpf. ns not significant, *p < 0.05. Exact values (mean ± SD) are shown in Supplementary Table 1.

Acknowledgments
This image is the copyrighted work of the attributed author or publisher, and ZFIN has permission only to display this image to its users. Additional permissions should be obtained from the applicable author or publisher of the image. Full text @ Sci. Rep.