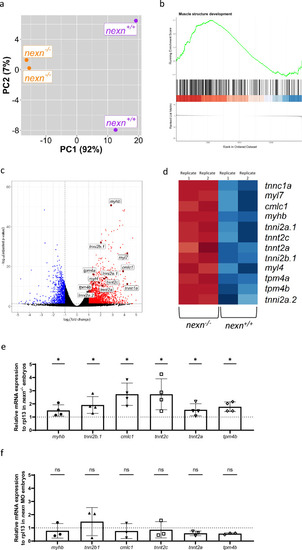
Nexn deficiency leads to upregulation of several genes encoding for sarcomeric proteins. (a) Principal component analysis (PCA) plot showing nexn+/+ and nexn−/− embryos (72 hpf) being clearly separated by PC1 (N = 2, n = 25). (b) Gene set enrichment analysis of the Gene Ontology term “muscle structure development” showing an overrepresentation of upregulated genes in nexn−/− embryos (normalized ES = 1.84; adjusted p = 1.14E−07). (c) Volcano plot of differentially expressed genes in nexn−/− compared to nexn+/+ embryos. Upregulated genes shown in red and downregulated genes shown in blue (adjusted p-value < 0.05 and |log2(FC)| > 0.5). Selected genes are labeled. (d) Heatmap showing selected genes of interest with clear difference regarding expression between nexn+/+ and nexn−/− embryos. High read counts shown in red and low read counts in blue. (e) Quantitative real-time PCR showing significantly increased myhb, tnni2b.1, cmlc1, tnnt2c, tnnt2c, tnnt2a and tpm4b transcript levels in nexn−/− compared to nexn+/+ embryos at 72 hpf. (f) Quantitative real-time PCR showing unaltered levels of myhb, tnni2b.1, cmlc1, tnnt2c, tnnt2c, tnnt2a and tpm4b in nexn MO-injected embryos compared to Ctrl MO-injected embryos at 72 hpf. ns not significant, *p < 0.05. Exact values (mean ± SD) are shown in Supplementary Table 1.
|
