IMAGE

Figure 4

ID
ZDB-IMAGE-231223-4
Source
Figures for Hofeichner et al., 2023
Image
Figure Caption

Figure 4

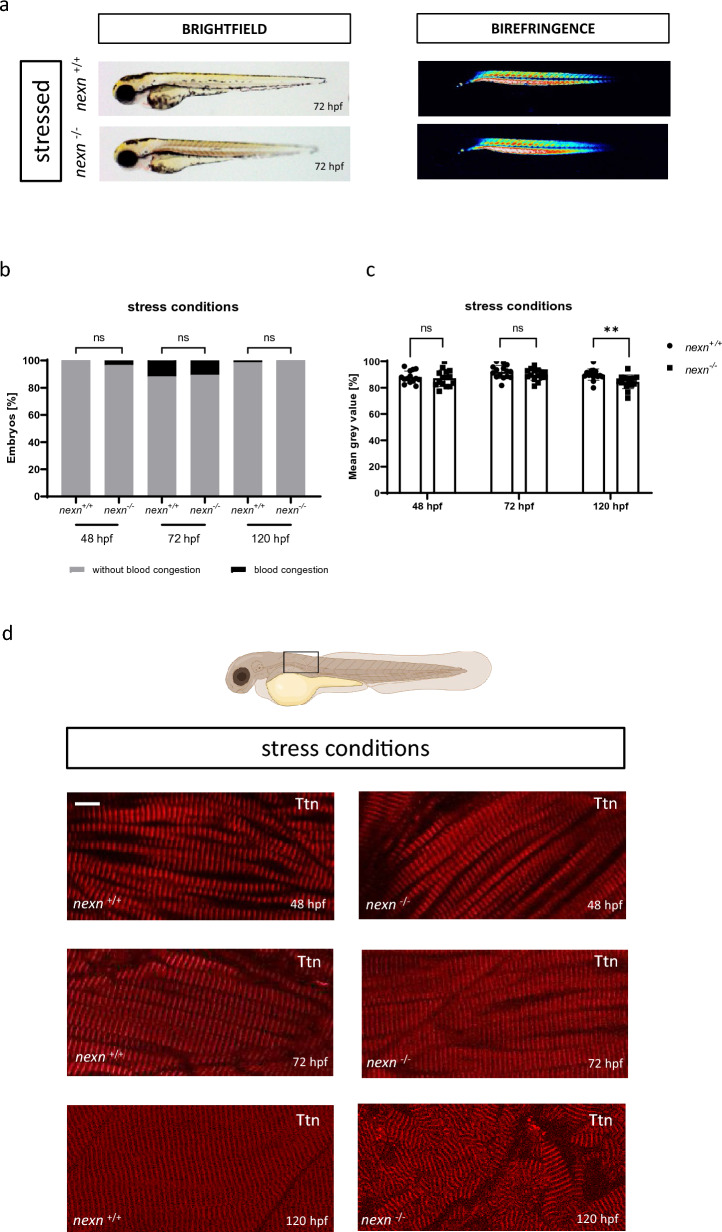
Increased muscular workload causes skeletal muscle disruption in later developmental stages of nexn knockout embryos. (a) Brightfield and birefringence images do not reveal phenotypical differences between nexn+/+ and nexn−/− embryos at 72 hpf. (b) Percentage of embryos showing phenotypical abnormalities does not differ between nexn+/+ and nexn−/− embryos at 48, 72 or 120 hpf (N = 3, mean ± SD, 48 hpf: p > 0.9999, 72 hpf: p = 0.8000, 120 hpf: p > 0.9999 using Mann–Whitney test). (c) Densitometric quantification of birefringence signals of nexn−/− and nexn+/+ embryos after stress reveals significant differences at 120 (N = 3, n = 15, mean ± SD, p < 0.0046 using two-tailed t-test) but not 48 or 72 hpf (N = 3, n = 14/15, mean ± SD, 48 hpf: p = 0.6516, 72 hpf: p = 0.2193 using two-tailed t-test). (d) Immunostaining of nexn+/+ and nexn−/− embryos after stress against Titin does not show altered muscle fibers at 48 and 72 hpf but severe muscle disruption in cranial regions (location shown in schematic illustration; created with biorender.com) at 120 hpf. Scale bar (1 µm) refers to all images. ns not significant, **p < 0.01. Exact values (mean ± SD) are shown in Supplementary Table 1.

Acknowledgments
This image is the copyrighted work of the attributed author or publisher, and ZFIN has permission only to display this image to its users. Additional permissions should be obtained from the applicable author or publisher of the image. Full text @ Sci. Rep.