FIGURE SUMMARY
Title

Impaired Detoxification of Trans, Trans-2,4-Decadienal, an Oxidation Product from Omega-6 Fatty Acids, Alters Insulin Signaling, Gluconeogenesis and Promotes Microvascular Disease

Authors
Qian, X., Klatt, S., Bennewitz, K., Wohlfart, D.P., Lou, B., Meng, Y., Buettner, M., Poschet, G., Morgenstern, J., Fleming, T., Sticht, C., Hausser, I., Fleming, I., Szendroedi, J., Nawroth, P.P., Kroll, J.
Source
Full text @ Adv Sci (Weinh)

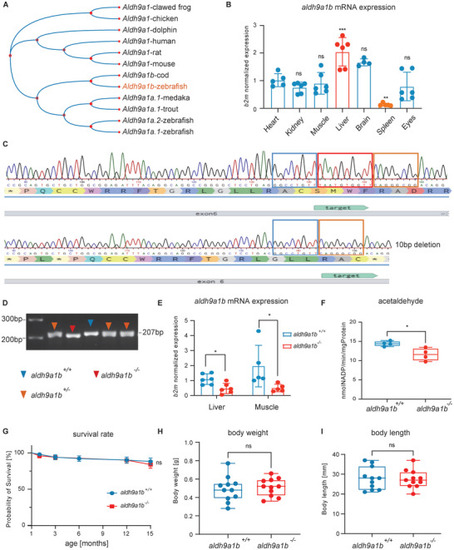
Generation and validation of aldh9a1b−/‐ zebrafish line using CRISPR/Cas9 technology (A) Neighbor‐joining phylogenetic bootstrap tree of amino acid sequence showed the evolutionary relationship of aldh9a1 and its isoforms in representative vertebrate animal species. B) aldh9a1b mRNA was mostly expressed in the liver, while least expressed in the spleen in aldh9a1b+/+ adult zebrafish, n = 5/6. C) aldh9a1b CRISPR knockout line was designed to target exon 6 and successfully generated a 10 bp deletion validated in cDNA sequencing. The 10 bp deletion resulted in an artificial stop codon indicated with a star. D) aldh9a1b+/+, aldh9a1b+/−, and aldh9a1b−/− zebrafish can be distinguished on a genotyping‐PCR gel. The blue, red, and yellow arrows indicated PCR products of cDNA from aldh9a1b+/+, aldh9a1b+/−, and aldh9a1b−/− zebrafish. E) mRNA levels of aldh9a1b were significantly decreased in livers and muscles of aldh9a1b−/− mutants, n = 6/5. F) aldh9a1b−/− mutants showed decreased Aldh enzyme activity using the substrate acetaldehyde at 5dpf, n = 4, 120 larvae per clutch. G) Survival rate was not significantly changed between aldh9a1b+/+ and aldh9a1b−/‐ zebrafish over the age of 1–15 months, n = 51 and n = 53. H,I) Adult aldh9a1b−/− mutants displayed a normal body weight (H) and body length (I) compared to aldh9a1b+/+ zebrafish, n = 11. mRNA Expression was quantified by RT‐qPCR and normalized to b2m. Each data point in this figure represented 20 larvae or one adult fish. The bars indicate mean ± SD values. Statistical analysis was performed by one‐way ANOVA, Student's t‐test, and log‐rank test. ns = not significant, *p < 0.05, **p < 0.01, ***p < 0.001. b2m, 𝛽2 microglobulin; Bp, base pair; dpf, days post fertilization.

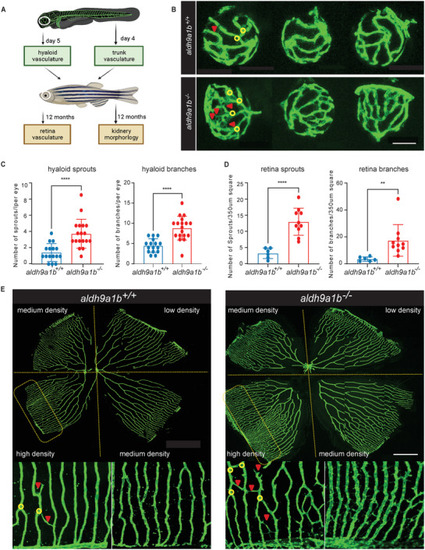
Alteration of the retinal vasculature in aldh9a1b−/− mutants (A) Graphical overview of phenotype exploration in aldh9a1b−/‐ zebrafish. B) Representative confocal images of hyaloid vasculature showed vascular alterations in aldh9a1b−/‐ larvae at 5dpf. Red arrows, sprouts; yellow circles, branch points. White scale bar = 50 µm. C) Quantification of increased hyaloid branchpoints and sprouts formation in aldh9a1b−/‐ larvae, n = 16/18. D) Quantification of increased retinal branch points and sprouts formation in adult aldh9a1b−/‐ zebrafish. One data point means one 350 µm2 square in high‐density retina, n = 8/10. E) Representative confocal images of adult retinal vasculature showed vascular alterations in aldh9a1b−/‐ zebrafish. Red arrows, sprouts; yellow circles, branch points. White scale bar = 500 µm. The bars indicate mean ± SD values. Statistical analysis was performed by Student's t‐test, **p < 0.01, ****p < 0.0001.

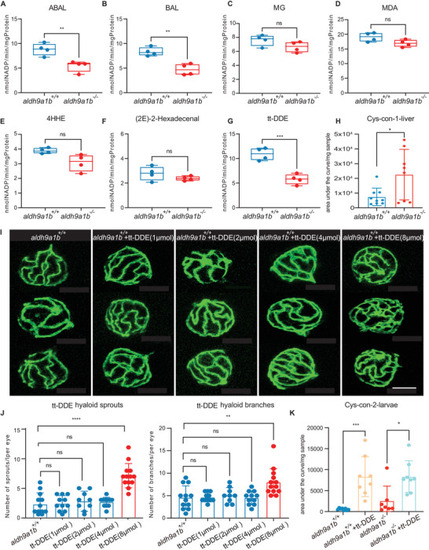
The link between tt‐DDE, Aldh9a1b, and angiogenesis (A‐G) Aldh enzyme activity was significantly decreased using substrate ABAL (A), BAL (B), and tt‐DDE (G), but unaltered with substrate MG (C), MDA (D), 4HHE (E) and 2(E)−2‐hexadecenal (F) in aldh9a1b−/‐ larvae at 5dpf. Each data point represented 120 larvae per clutch, n = 4. H) Cys‐con‐1 was significantly changed in aldh9a1b−/− livers. n = 9/8. I) Representative confocal images of hyaloid vasculature showed vascular alterations in aldh9a1b+/+ larvae treated with 0–8 µmol tt‐DDE at 5dpf. White scale bar = 50 µm. J) Quantification of increased hyaloid branch points and sprouts formation in 8 µmol tt‐DDE treated aldh9a1b+/+ zebrafish larvae, while no significant change in 1, 2, and 4 µmol tt‐DDE treatments were observed. One data point means one hyaloid per larva. K) Cys‐con2 was significantly increased in tt‐DDE‐treated larvae. n = 8/7. The bars indicate mean ± SD values. Statistical analysis was performed by Student's t‐test and one‐way ANOVA. ns = not significant, *p < 0.05, **p < 0.01, ***p < 0.001, ****p < 0.0001.

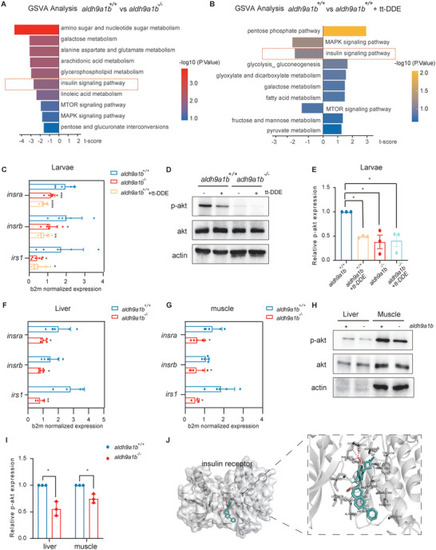
Downregulated insulin receptor signaling pathway in aldh9a1b−/‐ and in tt‐DDE treated zebrafish (A) GSVA analysis of RNA‐seq displayed top 10 insulin receptor signaling and carbon metabolism‐related pathways in aldh9a1b−/− larvae compared to aldh9a1b+/+ larvae at 5 dpf. Left, downregulated pathways; right; upregulated pathways. B) GSVA analysis of RNA‐seq displayed top 10 insulin receptor signaling and carbon metabolism‐related pathways in tt‐DDE treated aldh9a1b+/+ larvae compared to aldh9a1b+/+ controls. Left, downregulated pathways; right; upregulated pathways. C) mRNA expression of insra, insrb, and irs1 were significantly decreased in aldh9a1b−/− larvae and tt‐DDE treated aldh9a1b+/+ larvae at 5dpf, n = 6/7. D,E) Representative Western blot (D) and quantification (E) showed decreased p‐Akt activation in aldh9a1b−/− larvae and tt‐DDE treated aldh9a1b+/+ larvae at 5dpf. Total Akt protein served as a loading control, n = 3. F,G) mRNA expression of insra, insrb, and irs1 were significantly decreased in livers (F) and muscles (G) of aldh9a1b−/− adult zebrafish, n = 6/5. H,I) Representative Western blot and quantification showed reduced p‐Akt phosphorylation in aldh9a1b−/− in livers and muscles. J) Docking analysis showed tt‐DDE shared same binding pocket with linsitinib and bound to PHE1151, GLY1152 and MET1153 of insulin receptor. Pink sticks = tt‐DDE, blue sticks = linsitinib, dash line = hydrogen bonds. Total Akt served as loading control, n = 3. mRNA Expression was quantified by RT‐qPCR and normalized to b2m. Each data point in this figure represented 20 larvae or one organ per fish. The bars indicate mean ± SD values. Statistical analysis was performed by Student's t‐test and one‐way ANOVA, *p < 0.05, **p < 0.01, ***p < 0.001, ****p < 0.0001.

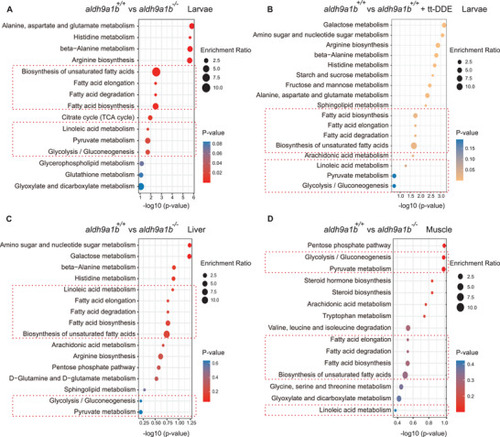
Altered glucose metabolism in aldh9a1b−/‐ and tt‐DDE treated zebrafish (A) Enrichment analysis of targeted metabolomics displayed top carbon metabolic pathways in aldh9a1b−/− larvae compared to aldh9a1b+/+ larvae at 5 dpf. B) Enrichment analysis of targeted metabolomics showed top carbon metabolic pathways in tt‐DDE treated aldh9a1b+/+ larvae compared to aldh9a1b+/+ controls. C,D) Enrichment analysis of targeted metabolomics displayed top carbon metabolic pathways in aldh9a1b−/− livers (C) and muscles (D) compared to aldh9a1b+/+. The red frame represented overlapped altered pathways among four comparisons.

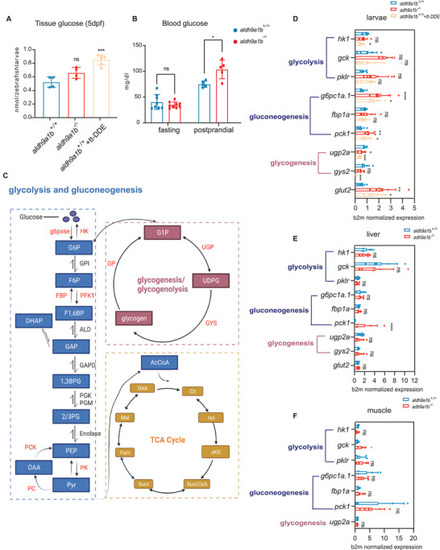
Impaired glucose homeostasis in aldh9a1b−/‐ and tt‐DDE treated zebrafish (A) The whole‐body glucose was significantly increased in tt‐DDE treated aldh9a1b+/+ larvae at 5 dpf. In aldh9a1b−/‐ larvae, whole‐body glucose was also increased, but not significantly, n = 4/6. B) Blood glucose of aldh9a1b−/− adults did not show any alteration in fasting state but was significantly increased in the 2‐hour postprandial state. C) Graphical overview of key biological processes in glucose metabolism. D) mRNA levels of key enzymes in glucose metabolism showed alterations of glycolysis, gluconeogenesis, and glycogenesis in aldh9a1b−/− and in tt‐DDE treated aldh9a1b+/+ larvae at 5dpf, n = 6/7. E,F) mRNA levels of key enzymes in glucose metabolism showed alterations of glycolysis, gluconeogenesis and glycogenesis in the livers (E) and muscles (F) of aldh9a1b−/− zebrafish, n = 6/5. mRNA Expression was quantified by RT‐qPCR and normalized to b2m. Each data point in this figure represented 20 larvae or one fish. The bars indicate mean ± SD values. Statistical analysis was performed by Student's t‐test and one‐way ANOVA, *p < 0.05, **p < 0.01, ***p < 0.001, ****p < 0.0001.

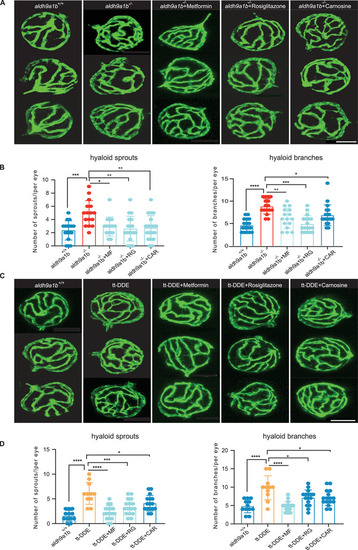
Altered angiogenic hyaloid vasculature caused by aldh9a1b knockout and tt‐DDE treatment can be rescued by metformin, rosiglitazone and carnosine (A) Representative confocal images of hyaloid vasculature showed vascular alterations and beneficial effects in aldh9a1b−/− zebrafish larvae treated with MF, RG, and CAR. White scale bar = 50 µm. B) Quantification of hyaloid branch points and sprouts formation showed increased angiogenic vasculature in aldh9a1b−/‐ can be rescued by metformin, rosiglitazone and carnosine. One data point means one hyaloid per larva. C) Representative confocal images of hyaloid vasculature showed vascular alterations and beneficial effects in aldh9a1b+/+ larvae co‐incubated with tt‐DDE and MF, RG, and CAR. White scale bar = 50 µm. D) Quantification of hyaloid branch points and sprout formation showed that increased angiogenic vasculature induced by tt‐DDE can be rescued by metformin, rosiglitazone, and carnosine. One data point means one hyaloid per larva. The bars indicate mean ± SD values. Statistical analysis was performed by one‐way ANOVA. *p < 0.05, **p < 0.01, ***p < 0.001, ****p < 0.0001. MF, metformin; RG, rosiglitazone; CAR, carnosine; PK, PK11195.

Acknowledgments
This image is the copyrighted work of the attributed author or publisher, and ZFIN has permission only to display this image to its users. Additional permissions should be obtained from the applicable author or publisher of the image. Full text @ Adv Sci (Weinh)