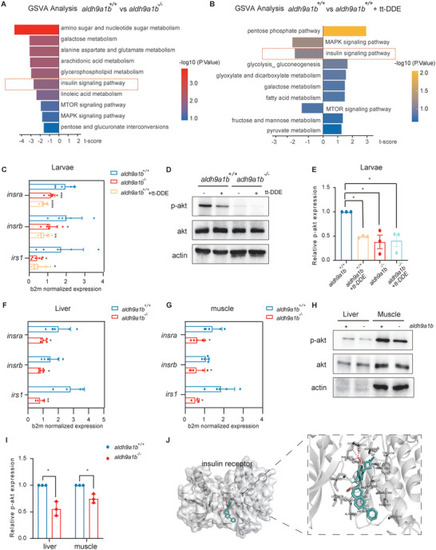
Downregulated insulin receptor signaling pathway in aldh9a1b−/‐ and in tt‐DDE treated zebrafish (A) GSVA analysis of RNA‐seq displayed top 10 insulin receptor signaling and carbon metabolism‐related pathways in aldh9a1b−/− larvae compared to aldh9a1b+/+ larvae at 5 dpf. Left, downregulated pathways; right; upregulated pathways. B) GSVA analysis of RNA‐seq displayed top 10 insulin receptor signaling and carbon metabolism‐related pathways in tt‐DDE treated aldh9a1b+/+ larvae compared to aldh9a1b+/+ controls. Left, downregulated pathways; right; upregulated pathways. C) mRNA expression of insra, insrb, and irs1 were significantly decreased in aldh9a1b−/− larvae and tt‐DDE treated aldh9a1b+/+ larvae at 5dpf, n = 6/7. D,E) Representative Western blot (D) and quantification (E) showed decreased p‐Akt activation in aldh9a1b−/− larvae and tt‐DDE treated aldh9a1b+/+ larvae at 5dpf. Total Akt protein served as a loading control, n = 3. F,G) mRNA expression of insra, insrb, and irs1 were significantly decreased in livers (F) and muscles (G) of aldh9a1b−/− adult zebrafish, n = 6/5. H,I) Representative Western blot and quantification showed reduced p‐Akt phosphorylation in aldh9a1b−/− in livers and muscles. J) Docking analysis showed tt‐DDE shared same binding pocket with linsitinib and bound to PHE1151, GLY1152 and MET1153 of insulin receptor. Pink sticks = tt‐DDE, blue sticks = linsitinib, dash line = hydrogen bonds. Total Akt served as loading control, n = 3. mRNA Expression was quantified by RT‐qPCR and normalized to b2m. Each data point in this figure represented 20 larvae or one organ per fish. The bars indicate mean ± SD values. Statistical analysis was performed by Student's t‐test and one‐way ANOVA, *p < 0.05, **p < 0.01, ***p < 0.001, ****p < 0.0001.
|
