
- Title
-
Transmembrane protein 14A protects glomerular filtration barrier integrity
- Authors
- Khalil, R., Bonnemaijer, J.D.D., Kreutz, R., Spaink, H.P., Hogendoorn, P.C.W., Baelde, H.J.
- Source
- Full text @ Physiol. Rep.
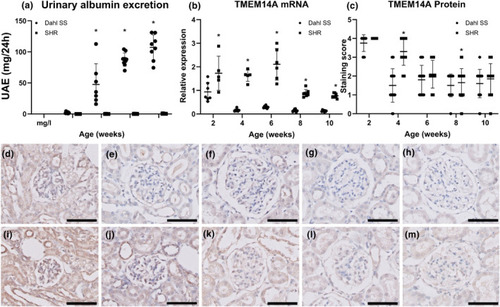
Glomerular TMEM14A expression was diminished before onset of proteinuria. (a) Urinary albumin excretion is significantly higher in Dahl rats compared to SHR from 6 weeks of age. Y‐axis shows urinary albumin excretion in mg/24 h, and the X‐axis shows animal age in weeks. (b) Glomerular TMEM14A mRNA expression in Dahl rats is significantly lower than in SHR controls at all time points. The Y‐axis shows mRNA expression as relative expression compared to |
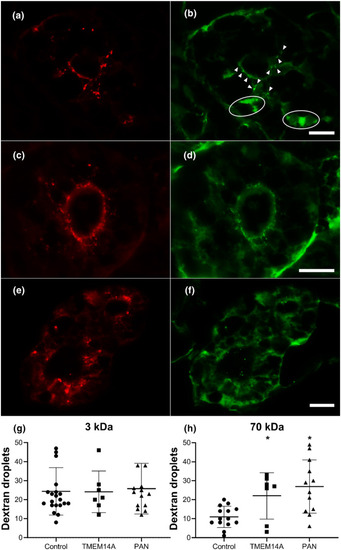
Knocking down TMEM14A mRNA translation causes proteinuria. Knocking down mRNA translation of the zebrafish homologue of TMEM14A through morpholino injection results in proteinuria. (a–f) Representative immunofluorescence images of transversal sections of zebrafish proximal tubule cells after injection of a mixture of red labeled 3 kDa dextran tracer (a, c, e) and green labeled 70 kDa dextran tracer (b, d, f) in controls (a,b), TMEM14A knockdowns (C and d), and PAN injected positive controls (e,f). Dextran tracers that passed the GFB are reabsorbed by proximal tubule epithelial cells in endosomes. Thus, reabsorbed dextran tracer appears as fluorescent droplets. The number of proximal tubule reabsorption droplets was counted in a blinded manner in sections as those shown here. The arrowheads in B point out examples of counted droplets. The circled areas show high fluorescence due to dextran present in the peritubular capillaries. These areas are not counted as reabsorption droplets. The sharpness of the images in panels A through F has been enhanced by overlaying them with a digital high pass filter. (g and h) Uptake of the red 3 kDa marker (g) was used to assess tubular reabsorption function, which was intact in both TMEM14A knockdown animals and controls. In the knockdown model, significantly more 70 kDa droplets (h) have passed the GFB and were subsequently reabsorbed. Puromycin aminonucleoside (PAN) injected zebrafish were used as positive controls. Students |
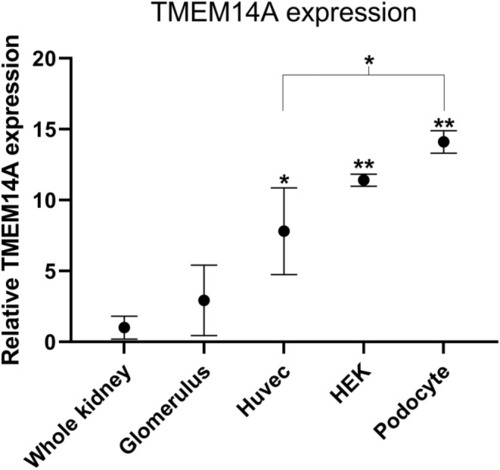
TMEM14A was primarily expressed by podocytes. In vitro experiments of relative TMEM14A mRNA expression show expression relative to GAPDH expression when comparing mRNA extracts from whole kidney, purified glomeruli, human umbilical vein endothelial cells (Huvec), human embryonic kidney (HEK), and finally podocytes. Expression in podocytes, HEK and Huvec was significantly higher than in whole kidney ( |
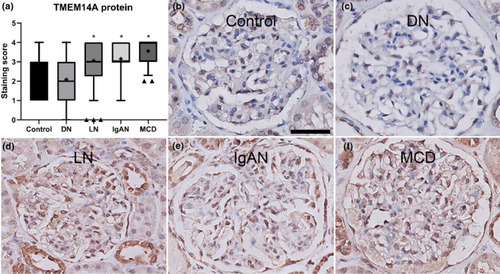
Glomerular TMEM14A expression was increased in human proteinuric renal diseases. (a) Glomerular TMEM14A protein expression was examined in human kidney biopsies from patients with diabetic nephropathy (DN), lupus nephritis (LN), IgA nephropathy (IgAN), minimal change disease (MCD), and healthy controls. Compared to controls, TMEM14A protein expression is significantly more extensive in IgAN, LN, and MCD, but not in DN. (b–f) Representative images of glomeruli stained for TMEM14A in healthy controls (b), diabetic nephropathy (c), lupus nephritis (d), IgA nephropathy (e), and minimal change disease (f). Slides were stained with goat anti‐TMEM14A antibody and immunoreactivity was assessed by diaminobenzidine. This results in a brown color which then indicates TMEM14A localization. Counterstaining with hematoxylin results in blue‐purple coloring of cell nuclei. Boxes in a show the range of values between the lower and upper quartile, the whiskers show 5th–95th percentile, triangles show values lying outside the 5th–95th percentile, the line in the box shows the median, and “+” indicates the mean. The scale bar in B applies to B through f and indicates 50 μm. |