FIGURE SUMMARY
Title

SCO-spondin knockout mice exhibit small brain ventricles and mild spine deformation

Authors
Xu, H., Dugué, G.P., Cantaut-Belarif, Y., Lejeune, F.X., Gupta, S., Wyart, C., Lehtinen, M.K.
Source
Full text @ Fluids Barriers CNS

Sspo−/− mice show a normal SCO but lack RF positive material in the SCO and ventricles. A Schematic depicting gene editing strategy. B Schematic depicting SCO location in sagittal brain sections corresponding to C. C BaseScope reveals lack of Sspo transcripts in the SCO of Sspo−/− mice (12 weeks). Scale = 1 mm (left panels) and 200 µm (right panels). D Schematic depicting the brain sectioning strategy taken to visualize SCO ependyma and proximal ventricular region. E RF positive material was not detected in Sspo−/− mice vs. controls. Scale = 50 µm

Sspo-deficiency leads to reduced ventricle volume at 6 weeks. A Schematic depicting brain regions captured by MRI and manual ventricle segmentation. B Representative sequential MR images of Sspo+/+ and Sspo−/− brains, showing reduced ventricle (white) sizes in Sspo−/− mice. C 3D rendering of lateral and third ventricles from Sspo+/+ and Sspo−/− mice. D Quantification of lateral and third ventricle volumes. Male and female mice were analyzed and plotted together but marked separately. * p = 0.0193, Welch’s t-test. Data presented as mean ± S.D

Sspo-deficiency has a mild impact on spinal curvature in the thoracic level. A Principle of the biplanar annotation approach used to measure three-dimensional spinal trajectories. A spline approximation of the spinal midline was first obtained on a horizontal projection image (right image in left panel); reference points (yellow dots) were then placed at the ventral aspect of intervertebral spaces on a lateral projection image computed from a stripe of voxels along the spline (middle); their medio-lateral position was interpolated using the spline, yielding a set of Cartesian coordinates describing the three-dimensional trajectory of the spine (right). The example mouse shown here was slightly tilted to the left, as shown by the coronal projection (left image in the left panel), resulting in an apparent deviation of the spine in the horizontal projection (right image in left panel); this apparent deviation disappeared after applying the corrective rotation computed using the three-dimensional trajectory (horizontal projection in right panel). A: anterior; D: dorsal; P: posterior; V: ventral. B Optimal alignments of individual spinal trajectories for wild type (Sspo+/+) and Sspo−/− mice grouped by gender and age (6 and 12 weeks). In each case, top and lateral views are shown (top and bottom curves, respectively). C Sketch detailing the calculation of local curvature angles. D Average curvature angle (± S.D., shaded area) at each vertebral position computed across mice grouped by gender, age (6 and 12 weeks) and genotype. Vertebral levels at which significant differences between Sspo−/− and Sspo+/+ mice were found using linear mixed-effects models followed by post hoc pairwise comparisons are indicated (*: p < 0.05; **: p < 0.001; see values in the text). Vertical gray dashed lines indicate regional limits (Ce: cervical; T: thoracic; L: lumbar; S: sacral; Ca: caudal)

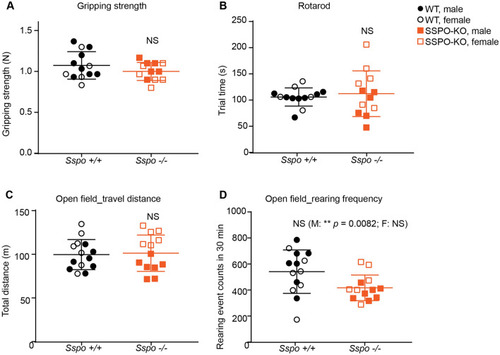
Sspo-deficiency does not alter basic motor tasks in 12–14 week old adult mice. No behavioral differences were observed in Sspo−/− mice compared to wild type littermate controls in A forelimb gripping strength (not significant, N = 13 wild type, 8 males and 5 females, N = 12 Sspo−/−, 6 males and 6 females, p = 0.20), B average time spent on the rotarod (not significant, N = 13 wild type, 8 males and 5 females, N = 12 Sspo−/−, 6 males and 6 females, p = 0.64), C total distance traveled during each 30 min (not significant, N = 14 wild type, 7 males and 7 females, N = 13 Sspo−/−, 7 males and 6 females, p = 0.83). open-field test, and D number of rearing events during each 30 min (N = 14 wild type, 7 males and 7 females, N = 13 Sspo−/−, 7 males and 6 females, p = 0.0262 (significant p with Sidak correction for multiple comparison in open field test is 0.0170). If analyzing males only, ** p = 0.0082). Open field test. All panels have male and female marked separately and analyzed together unless specified. Welch’s t-test

Acknowledgments
This image is the copyrighted work of the attributed author or publisher, and ZFIN has permission only to display this image to its users. Additional permissions should be obtained from the applicable author or publisher of the image. Full text @ Fluids Barriers CNS