IMAGE

Fig. 2

ID
ZDB-IMAGE-231206-7
Source
Figures for Xu et al., 2023
Image
Figure Caption

Fig. 2

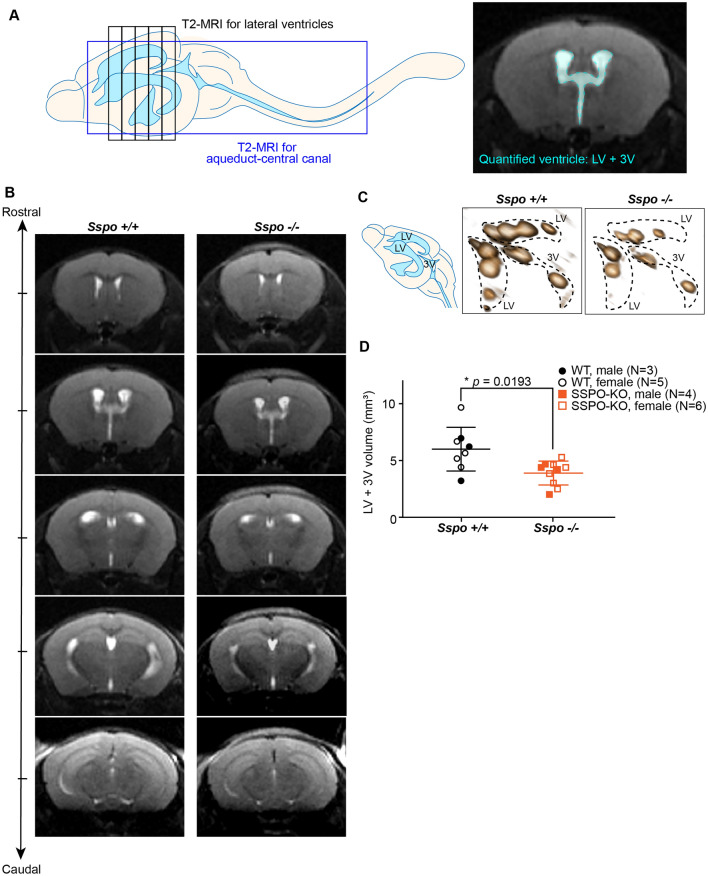
Sspo-deficiency leads to reduced ventricle volume at 6 weeks. A Schematic depicting brain regions captured by MRI and manual ventricle segmentation. B Representative sequential MR images of Sspo+/+ and Sspo−/− brains, showing reduced ventricle (white) sizes in Sspo−/− mice. C 3D rendering of lateral and third ventricles from Sspo+/+ and Sspo−/− mice. D Quantification of lateral and third ventricle volumes. Male and female mice were analyzed and plotted together but marked separately. * p = 0.0193, Welch’s t-test. Data presented as mean ± S.D

Acknowledgments
This image is the copyrighted work of the attributed author or publisher, and ZFIN has permission only to display this image to its users. Additional permissions should be obtained from the applicable author or publisher of the image. Full text @ Fluids Barriers CNS