IMAGE

Fig. 1

ID
ZDB-IMAGE-231206-6
Source
Figures for Xu et al., 2023
Image
Figure Caption

Fig. 1

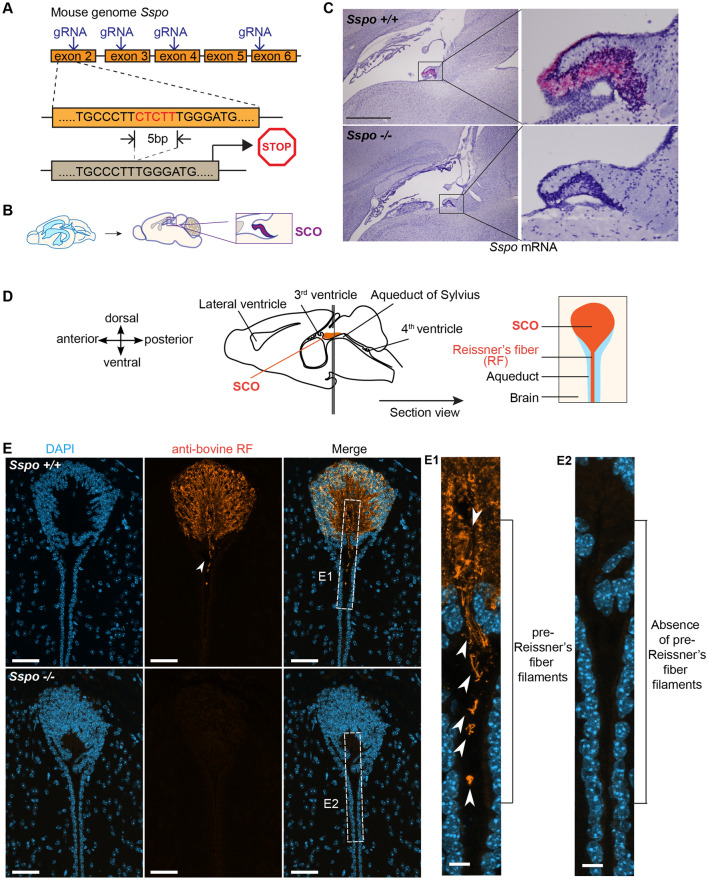
Sspo−/− mice show a normal SCO but lack RF positive material in the SCO and ventricles. A Schematic depicting gene editing strategy. B Schematic depicting SCO location in sagittal brain sections corresponding to C. C BaseScope reveals lack of Sspo transcripts in the SCO of Sspo−/− mice (12 weeks). Scale = 1 mm (left panels) and 200 µm (right panels). D Schematic depicting the brain sectioning strategy taken to visualize SCO ependyma and proximal ventricular region. E RF positive material was not detected in Sspo−/− mice vs. controls. Scale = 50 µm

Acknowledgments
This image is the copyrighted work of the attributed author or publisher, and ZFIN has permission only to display this image to its users. Additional permissions should be obtained from the applicable author or publisher of the image. Full text @ Fluids Barriers CNS