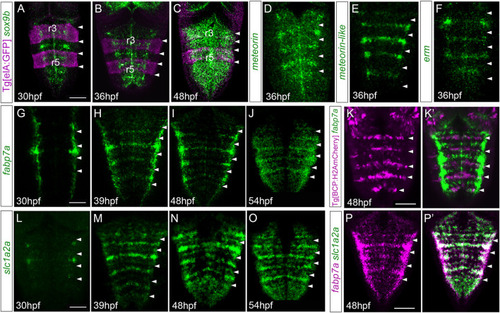
Hindbrain rhombomere centers display a specific combination of gene expression. (A–C) Tg[elA:GFP], (D–J,L–P,P’) wild type, or (K,K’) Tg[BCP:H2AmCherry] embryos at the indicated embryonic stages were in situ hybridized with sox9(A–C), meteorin(D), meteorin-like(E), erm(F), fabp7a(G–K,K’,P,P), and slc1a2a(L–P, P’). Images are displayed as the single gene expression channel (D–K, L–P) or the overlay of the two corresponding channels (A–C, K’, P’). All images are dorsal maximal intensity projections (MIP) with anterior to the top. White arrowheads indicate the rhombomeric boundaries. Note the enrichment of several markers in rhombomere centers. r3 and r5, rhombomeres 3 and 5. Scale bar, 50 μm.

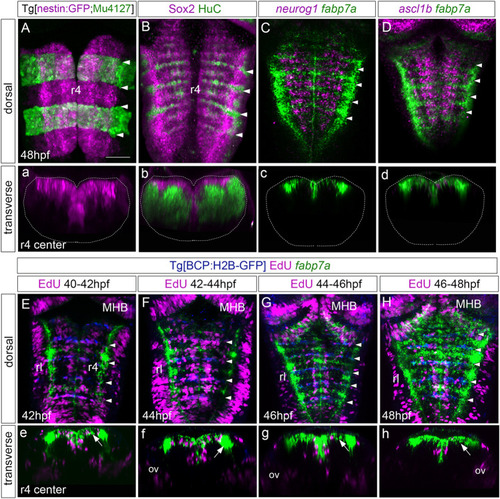
Rhombomere centers harbor proliferating neural progenitors. (A) Tg[nestin:GFP; Mu4127] embryos at 48 hpf displaying neural progenitors in magenta and the r3 and r5 landmarks in green. (B) Wild-type embryos immunostained with anti-Sox2 (magenta) to visualize the neural progenitors and with anti-HuC (green) to label the differentiated neurons at 48 hpf. (C,D) Wild-type embryos in situ hybridized with fabp7a (green) to stain progenitors and neurog1 or ascl1b (magenta) to label neuronal committed cells at 48 hpf. (a–d) Transverse views of (A–D) through the center of r4. (a) Images displaying a single channel or (b–d) the overlay of both channels. (E–H) Tg[BCP:H2B-GFP] embryos were incubated with EdU for 2h, in situ hybridized with fabp7a, and immunostained with anti-GFP to label boundary cells. The EdU-positive cells are displayed in magenta, the boundaries in blue, and fabp7a expression indicating the center of the rhombomeres in green. (e–h) Transverse views of (E–H) through the r4 center. White arrows in (e–h) indicate fabp7a cells that did not incorporate EdU. (A–H) Dorsal MIP with anterior to the top displaying all channels. White arrowheads indicate the rhombomeric boundaries. Dotted lines in (a–d) indicate the contour of the neural tube. ov, otic vesicle; rl, rhombic lip. Scale bar, 50 μm.

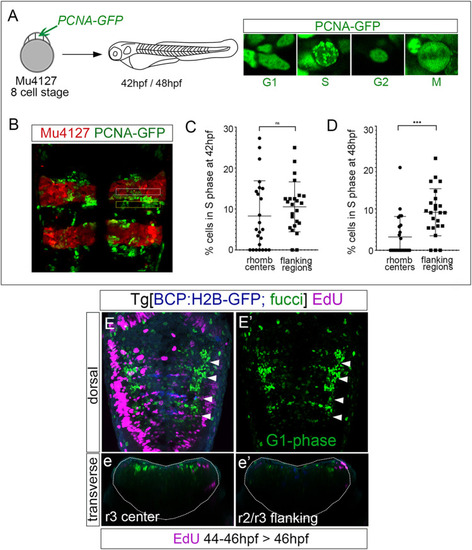
Rhombomere centers harbor G1-phase-arrested progenitors. (A) Scheme depicting the experimental design of the in vivo PCNA-GFP clonal analysis. Mu4127 embryos displaying mCherry in r3 and r5 were injected with PCNA-GFP at the 8-cell stage, and hindbrains were analyzed at 42 hpf and 48 hpf. Images show examples of the different distributions of PCNA-GFP within the cell nuclei along the cell cycle phases. (B) Example of the hindbrain of Mu4127 embryos injected with PCNA-GFP used for quantification analysis. Rhombomere centers and boundary-flanking regions used for quantification are framed in white and yellow, respectively. (C,D) Graphs illustrating the percentage of cells in the S-phase in rhombomere centers and boundary-flanking regions at 42 hpf and 48 hpf, respectively. S-phase cells at 42 hpf: 8.2% in rhombomere centers vs. 10.5% in boundary-flanking regions. S-phase cells at 48 hpf: 3.2% in rhombomere centers vs. 9.1% in boundary-flanking regions. Wilcoxon test analysis is shown: ns, non-significant, ***p < 0.001, N = 4 embryos, n = 24 boundaries, n = 24 flanking regions. (E,E’) Double transgenic Tg[BCP:H2B-GFP; fucci] embryos were incubated with EdU for 2 h and analyzed at 46 hpf. Boundaries are depicted in blue, G1-phase cells in green, and EdU-positive cells in magenta. Note that G1-phase cells are mainly located in the center of the rhombomeres and did not incorporate EdU. Dorsal MIP with anterior to the top displaying a merge of channels (E) and only G1-phase cells in the green channel (E’). White arrowheads indicate the rhombomere boundaries. (e,e’) Transverse views of (E) at the level of the r3 center and r2/r3 flanking region, respectively. Dotted lines in (e,e’) indicate the contour of the neural tube.

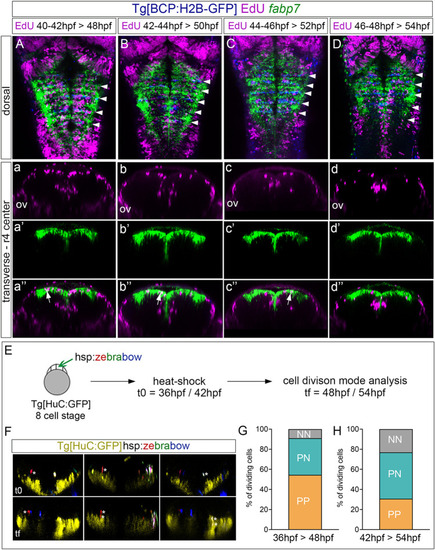
Proliferating progenitor cells within the rhombomere centers shift their division mode over time. (A–D) Tg[BCP:H2B-GFP] embryos were pulsed with EdU at the indicated intervals and chased for 6 h to analyze the position of the derivatives of cells that underwent the S-phase. EdU is depicted in magenta, hindbrain boundaries in blue, and fabp7a cells enriched in the center of the rhombomeres in green. (A–D) Dorsal projections with anterior to the top. White arrowheads indicate the rhombomere boundaries. (a–d, a’–d’, a’’–d’’) Transverse views of (A–D) through the center of r4 displaying either the EdU cells (a–d), the fabp7a cells (a’–d’), or the merge of both (a’’–d’’). ov, otic vesicle. (E) Analysis of the progenitor cell division mode within the rhombomere centers. Scheme depicting the multicolor clonal growth experimental approach. Tg[HuC:GFP] embryos at the 8-cell stage were injected with the hsp:zebrabow construct and heat-shocked 1 h before the imaging time. Embryos were in vivo imaged at 36 hpf or 42 hpf (t0), and then at 48 hpf or 54 hpf (tf), respectively. The cell division mode was analyzed in all the clones. (F) Transverse projections generated at t0 and tf showing examples of the three observed clonal cell behaviors: a cell undergoing symmetric proliferative division (PP, red cell not expressing HuC at t0 and the daughter cells not expressing it at tf; white asterisks), a cell undergoing asymmetric division (PN, red cell not expressing HuC at t0, with only one of the daughters expressing HuC at tf; white asterisks), and a cell undergoing symmetric neurogenic division (NN, white cell not expressing HuC at t0, but both daughters expressing HuC at tf; white asterisks). The neuronal differentiation domain is displayed in yellow. (G,H) Stacked bar graphs showing the percentage of PP (orange), PN (blue), and NN (gray) cell division modes in the rhombomere centers between two different time intervals: 36–48 hpf (G; n = 11 cells, N = 4 embryos) and 42–54 hpf (H; n = 13 cells N = 5 embryos).

Rhombomere centers display Notch activity. (A,B) Mu4127 Tg[tp1:d2GFP] and Tg[BCP:H2AmCherry; tp1:d2GFP] embryos as the readout of Notch activity (green) with r3 and r5 or boundaries (magenta) as landmarks at 48 hpf. (a,b) Transverse views of (A,B) through the center of r4 or the r4/r5 boundary. Dotted lines indicate the contour of the neural tube. (C) Tg[tp1:d2GFP] embryos displaying Notch activity (magenta) and immunostained with fabp7a (green) at 48 hpf. (c–c’’) Transverse view of (C) showing only the ventricular domain through the center of r4 displaying either both channels (c) or single channels (c’–c’’). (D–G) Wild-type embryos in situ hybridized either with notch3(D–F) or notch3 and fabp7a(G) at the indicated stages. (g–g’’) Transverse view of (G) showing only the ventricular domain through the center of r4 displaying either both channels (g) or single channels (g’–g’’). (H–K) Wild-type embryos were in situ hybridized either with hey1(H–J) or hey1 and fabp7a(K) at the indicated stages. (k–k’’) Transverse view of (K) showing only the ventricular domain through the center of r4 displaying either both channels (k) or fabp7a or hey1(k’–k’’). (A–K) Dorsal MIP with anterior to the top. White arrowheads indicate the rhombomere boundaries. Scale bar, 50 μm.

Progenitor cells in the rhombomere centers are Notch-responsive. Wild-type embryos were treated with either DMSO (A–E, K–L) or the gamma-secretase inhibitor LY411575 (F–J, M,N) for 6 h at 36 hpf (A–J) or at 48 hpf (K–N). Embryos were in situ hybridized with fabp7a(A,F,K,M), slc1a2a(B,G), neuroD4(C,H), and hey1(E,J), or immunostained with Sox2 and HuC (D,I,L,N). Dorsal MIP with anterior to the top. White arrowheads indicate the rhombomere boundaries. Numbers at the bottom indicate the individuals with the displayed phenotype over the total of analyzed specimens. Scale bar, 50 μm.

notch3 mutation accounts for the loss of Notch activity in the center of the rhombomeres and results in neuronal differentiation. (A–J) Control and notch3fh322/fh322 embryos in the Tg[tp1:d2GFP] background were in situ hybridized with fabp7a (B, G), ascl1b(C,H), neuroD4(D,I), or hey1(E,J) at 48 hpf. (K–N) Control and hey1ha11/ha11 embryos were in situ hybridized with fabp7a(K,M) and ascl1b(L,N) at 48 hpf. Dorsal MIP with anterior to the top. White arrowheads indicate the rhombomere boundaries. Numbers at the bottom indicate the individuals with the displayed phenotype over the total of analyzed specimens. As control embryos, either wild-type or heterozygous embryos were used. Scale bar, 50 μm.

Acknowledgments
This image is the copyrighted work of the attributed author or publisher, and ZFIN has permission only to display this image to its users. Additional permissions should be obtained from the applicable author or publisher of the image. Full text @ Front Cell Dev Biol