
- Title
-
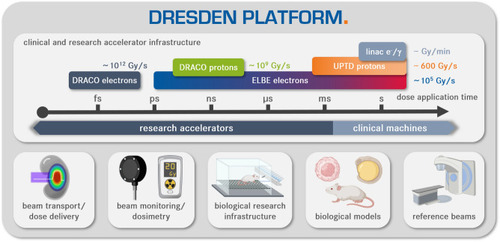
The DRESDEN PLATFORM is a research hub for ultra-high dose rate radiobiology
- Authors
- Metzkes-Ng, J., Brack, F.E., Kroll, F., Bernert, C., Bock, S., Bodenstein, E., Brand, M., Cowan, T.E., Gebhardt, R., Hans, S., Helbig, U., Horst, F., Jansen, J., Kraft, S.D., Krause, M., Leßmann, E., Löck, S., Pawelke, J., Püschel, T., Reimold, M., Rehwald, M., Richter, C., Schlenvoigt, H.P., Schramm, U., Schürer, M., Seco, J., Szabó, E.R., Umlandt, M.E.P., Zeil, K., Ziegler, T., Beyreuther, E.
- Source
- Full text @ Sci. Rep.
Graphical representation of the |
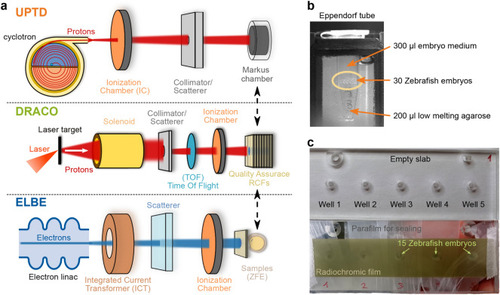
Graphical representation of the temporal sequence of the beam bunches of different irradiation regimes across the dresden platform accelerator landscape. Colored x-axis labels mark the dose application time for the delivery of ∼30Gy prescribed dose to a ZFE sample in the correspondingly colored irradiation regime. For quantitative details on all irradiation regimes, refer to the main text and Table 1. (a) Protons: Orange bars depict the proton bunches of the UPTD’s cyclotron at a fixed frequency of 106MHz with bunches of ns duration (bar width not to scale). Green bars represent the ns long laser-driven proton bunches at DRACO. The dark green bar illustrates single-bunch ZFE irradiation; the light green bars show accumulated dose delivery, featuring a realistic 20s time interval between bunches (not applied in ZFE study). (b) Electrons: The depicted ELBE electron bunches feature a bunch length of 5ps at a bunch frequency of 13MHz (bar width not to scale, on ns-scale bunches of different irradiation regimes are drawn next to each other for improved visibility). Five macro pulses of 63μs length 40ms apart were applied in the ELBEsynUHDR irradiation regime. |
( |
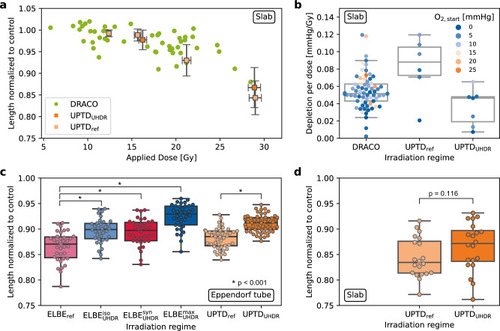
Summary of all ZFE experiments conducted across the dresden platform. The used sample holders are stated for every sub-figure. ZFE length data were normalized to respective unirradiated controls to correct for batch-dependent size differences and are presented (if applicable) in the form of box plots for comparison. The box ranges from the lower to the upper quartile of the data set. The horizontal line marks the median. The height of the box is the interquartile range (IQR). Whiskers mark the minimum and maximum values within the data set excluding outliers (distance >1.5×IQR from the lower/upper quartile). (a) Results of ZFE proton irradiation studies. Green dots represent individual single-bunch irradiations at DRACO with delivered doses between ∼6Gy and ∼28Gy. Orange squares show grouped data taken at UPTD with 1σ standard deviation. Prescribed dose values have been varied to allow for a comparison to the DRACO dose-response curve. (b) Corresponding oxygen depletion per dose at the proton accelerators as a function of the measured initial oxygen level pO2,start. (c) and (d) Results of ZFE irradiation studies conducted at UPTD and ELBE at ∼30Gy delivered dose (details in Table 2), data in (d) corresponds to the rightmost data points shown in (a). Comparing the identically scaled UPTD Eppendorf tube data and the slab data reveal a larger variation in radiation damage for the slabs. |
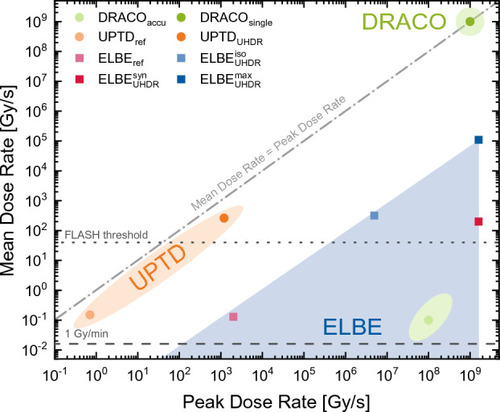
Accessible peak and mean dose rate combinations of the |