
Figure 4
- ID
- ZDB-FIG-240216-41
- Publication
- Metzkes-Ng et al., 2023 - The DRESDEN PLATFORM is a research hub for ultra-high dose rate radiobiology
- Other Figures
- All Figure Page
- Back to All Figure Page
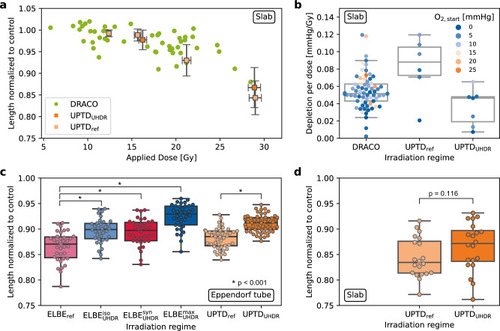
Summary of all ZFE experiments conducted across the dresden platform. The used sample holders are stated for every sub-figure. ZFE length data were normalized to respective unirradiated controls to correct for batch-dependent size differences and are presented (if applicable) in the form of box plots for comparison. The box ranges from the lower to the upper quartile of the data set. The horizontal line marks the median. The height of the box is the interquartile range (IQR). Whiskers mark the minimum and maximum values within the data set excluding outliers (distance >1.5×IQR from the lower/upper quartile). (a) Results of ZFE proton irradiation studies. Green dots represent individual single-bunch irradiations at DRACO with delivered doses between ∼6Gy and ∼28Gy. Orange squares show grouped data taken at UPTD with 1σ standard deviation. Prescribed dose values have been varied to allow for a comparison to the DRACO dose-response curve. (b) Corresponding oxygen depletion per dose at the proton accelerators as a function of the measured initial oxygen level pO2,start. (c) and (d) Results of ZFE irradiation studies conducted at UPTD and ELBE at ∼30Gy delivered dose (details in Table 2), data in (d) corresponds to the rightmost data points shown in (a). Comparing the identically scaled UPTD Eppendorf tube data and the slab data reveal a larger variation in radiation damage for the slabs. |