FIGURE SUMMARY
Title

Sclerotome-derived PDGF signaling functions as a niche cue responsible for primitive erythropoiesis

Authors
Mao, A., Li, Z., Ning, G., Zhou, Z., Wei, C., Li, J., He, X., Wang, Q.
Source
Full text @ Development

Suppression of PDGF signaling leads to a reduction of erythrocytes. (A) Detection of hemoglobin levels by o-dianisidine staining in wild-type (WT) and pdgfαa−/−;pdgfαb−/− (pdgfαa/b−/−) embryos at 48 hpf. Ventral view. (B) Merged brightfield and confocal images from live imaging of pdgfαa−/−;pdgfαb−/− embryos in the Tg(gata1:dsRed) background at 32 hpf. Lateral view with anterior to the left. Scale bar: 100 μm. (C,D) Expression analysis of (C) gata1 and (D) hbbe3 in WT and pdgfαa−/−;pdgfαb−/− embryos at 22 hpf by in situ hybridization. Lateral view with anterior to the left. (E,F) WT embryos were treated with 0.25 μM inhibitor V from shield stage then harvested at the indicated developmental stages for (E) o-dianisidine staining (ventral view) or (F) gata1 in situ hybridization (lateral view with anterior to the left). Images shown are representative of the observed phenotypes. In A and C-F, the number of embryos displaying each phenotype out of the total number assayed is indicated. Images in B are representative of 35 WT embryos and 40 pdgfαa/b−/− embryos. The number of red blood cells was moderately decreased in about two-thirds of the pdgfαa/b−/− embryos, and severely reduced in the rest of the mutant embryos.

pdgfαa and pdgfαb are necessary for erythroid progenitor differentiation but are dispensable for the development of endothelial and myeloid lineages. (A) Expression patterns of npas4 l and scl in wild-type (WT) and pdgfαa−/−;pdgfαb−/− (pdgfαa/b−/−) embryos at the two-somite stage (2 ss) as revealed by in situ hybridization. Dorsal view. (B) Expression of gata1 and hbbe3 in WT and pdgfαa−/−;pdgfαb−/− embryos at the 10-somite stage (10 ss) assayed by in situ hybridization. Dorsal view. (C,D) In situ hybridization expression analysis of (C) etv2 (dorsal view) and (D) flk (lateral view with head to the left) in WT and pdgfαa−/−;pdgfαb−/− embryos at the indicated stages. (E) Confocal images of pdgfαa−/−;pdgfαb−/− mutants in the Tg(flk:GFP) background at 36 hpf. Lateral view. Scale bar: 50 μm. (F-H) Expression patterns of pu.1 in WT and pdgfαa−/−;pdgfαb−/− embryos at the indicated stages as revealed by in situ hybridization. Dorsal view. (I) Expression analysis of lcp1 and mpx in WT and pdgfαa−/−;pdgfαb−/− embryos at 24 hpf by in situ hybridization. Ventral view in the left panel and lateral view in the right panel. Images shown are representative of the observed phenotypes. The number of embryos displaying each phenotype out of the total number assayed is indicated.

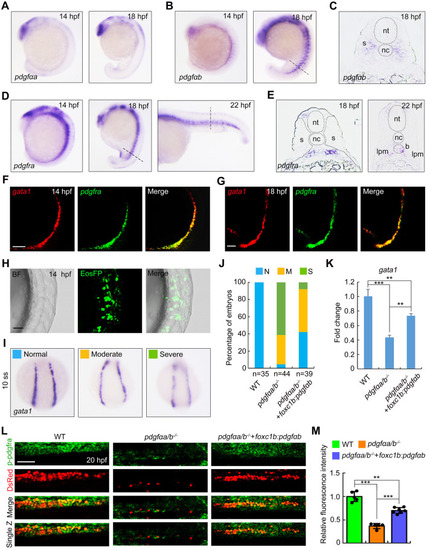
Overexpression of pdgfαb in sclerotome is sufficient to rescue primitive erythropoietic defects in pdgfαa−/−;pdgfαb−/− embryos. (A) Expression analysis of pdgfαa in wild-type embryos at the indicated stages by in situ hybridization. Lateral view with anterior to the top. (B,C) Expression profile of pdgfαb in wild-type embryos assayed by in situ hybridization at the indicated stages and displayed (B) as whole mounts (lateral view with anterior to the top) or (C) in section. Dashed line in B indicates the position of the section in C. (D,E) Expression patterns of pdgfra in wild-type embryos assayed by in situ hybridization at the indicated stages, shown as (D) whole mounts or (E) sections. Dashed lines in D represent the positions of the sections in E. B, blood cell; lpm, lateral plate mesoderm; nc, notochord; nt, neural tube; s, somite. (F,G) Colocalization analysis of pdgfra and gata1 transcripts in wild-type embryos at (F) 14 hpf and (G) 18 hpf by dual-color fluorescence in situ hybridization. Lateral view with anterior to the top. Scale bars: 50 μm. (H-K) pdgfαa−/−;pdgfαb−/− (pdgfαa/b−/−) embryos were injected with 30 pg foxc1b:pdgfαb-P2A-EosFP plasmid and 200 pg Tol2 transposase mRNA at the one-cell stage, and then harvested for in vivo confocal imaging or in situ hybridization alongside uninjected WT and pdgfαa/b−/− control embryos. (H) Representative brightfield (BF) and confocal images of a pdgfαa/b−/− embryo injected with the plasmid foxc1b: pdgfαb-P2A-EosFP and Tol2 mRNA at 14 hpf. Lateral view with anterior to the top. Scale bar: 50 μm. (I) The transcripts of gata1 were evaluated by in situ hybridization at 10-somite stage (10 ss). Representative images of the phenotypes observed in uninjected WT or pdgfαa/b−/− control embryos and pdgfαa/b−/− embryos injected with the indicated plasmid and Tol2 transposase mRNA. (J) The percentage of embryos scored as being normal (N) or as having moderate (M) or severe (S) defects for the indicated genotypes. (K) Quantitative real-time PCR was performed to examine the expression of gata1 in the indicated embryos, and the values are expressed as mean±s.d. Fold change relative to WT from three independent experiments. One-way ANOVA with Scheffe post-hoc test was used to analyze the statistical differences between groups. **P<0.01, ***P<0.001. (L,M) Immunofluorescence assay of p-Pdgfra in Tg(gata1:dsRed) background embryos. WT and pdgfαa/b−/− control embryos were uninjected, and pdgfαa/b−/− embryos were injected with foxc1b:pdgfαb-P2A-EosFP plasmids and Tol2 transposase mRNA as described in H. (L) Lateral views with anterior to the left. Scale bar: 50 μm. (M) The average fluorescence intensity of p-Pdgfra in the ICM region of each group was calculated using ImageJ software, and the fluorescence intensity values relative to WT are shown as mean±s.d. (n>5) from three independent experiments. One-way ANOVA test with Scheffe post-hoc test was used to analyze the statistical differences between groups. **P<0.01, ***P<0.001.

ERK1/2 functions downstream of PDGF signaling to promote primitive erythrocyte development. (A,B) Immunostaining of phosphorylated ERK1/2 (p-ERK) in wild-type (WT) and pdgfαa−/−;pdgfαb−/− (pdgfαa/b−/−) Tg(gata1:dsRed) embryos. (A) Representative confocal images. Single sections of the boxed areas are shown as enlarged images in the bottom panels. Lateral view with anterior to the left. The white arrows indicate endothelial cells of the DA. Scale bars: 50 μm. This experiment was repeated independently three times with similar results. (B) Average fluorescence intensity of p-ERK in the ICM region was calculated using ImageJ software, and the fluorescence intensity values relative to WT are shown as mean±s.d. (n=8). Two-tailed, unpaired Student's t-test was used to analyze the difference between groups. ***P<0.001. (C) In situ hybridization expression analysis of gata1 in WT embryos treated with 25 μM U0126 or DMSO as a vehicle control from the shield stage to the 10-somite stage (10 ss). Dorsal view. (D) Determination of hemoglobin levels by o-dianisidine staining in U0126-treated WT embryos at 48 hpf. Ventral view. Images shown in C and D are representative of the observed phenotypes. The number of embryos displaying each phenotype out of the total number assayed is indicated. (E,F) Immunostaining staining of p-ERK at 20 hpf in Tg(gata1:dsRed) background embryos. pdgfαa/b−/− embryos were injected with 30 pg foxc1b-pdgfαb-P2A-EosFP plasmids and 200 pg Tol2 transposase mRNA at the one-cell stage. WT and pdgfaαa/b−/− control groups were uninjected. (E) Representative confocal images. Lateral views. Scale bar: 50 μm. (F) The average fluorescence intensity of p-ERK in the ICM region was calculated using ImageJ software, and the fluorescence intensity values relative to WT are shown as mean±s.d. (n≥5) from three independent experiments. One-way ANOVA with Scheffe post-hoc test was used to analyze the statistical differences between groups. **P<0.01, ***P<0.001. (G-I) pdgfαa−/−;pdgfαb−/− embryos were injected with 20 pg caMEK1 mRNA at the one-cell stage and then harvested alongside uninjected WT and pdgfαa/b−/− control embryos for detection of gata1 expression by in situ hybridization at 10 ss. (G) Representative images of observed phenotypes. Dorsal view. (H) The percentage of embryos scored as being normal (N) or as having moderate (M) or severe (S) defects for the indicated treatment groups. (I) Quantitative real-time PCR was performed to examine the expression of gata1 in the indicated embryos, and the values are expressed as mean±s.d. Fold change relative to WT from three independent experiments. One-way ANOVA with Tukey post-hoc test to analyze the statistical differences between groups. **P<0.01, ***P<0.001. (J-L) Hemoglobin levels in embyros as described in G-I were examined at 48 hpf using o-dianisidine staining. (J) Representative images of phenotypes observed. Ventral view. (K) The percentage of embryos scored as being normal (N) or as having moderate (M) or severe (S) defects for the indicated treatment groups. (L) Quantitative real-time PCR was performed to examine the expression of hbae1, hbae3, hbbe2 and hbbe3, and the values are expressed as mean±s.d. Fold change relative to WT from three independent experiments. One-way ANOVA with Tukey post-hoc test was used to analyze the statistical differences between groups. *P<0.05; **P<0.01; ***P<0.001; ns, not significant. (M) A proposed model illustrating that PDGF ligands derived from sclerotome interact with and activate their receptors in the nearby lateral plate mesoderm, thereby supporting erythroid progenitor differentiation. LPM, lateral plate mesoderm.

Acknowledgments
This image is the copyrighted work of the attributed author or publisher, and ZFIN has permission only to display this image to its users. Additional permissions should be obtained from the applicable author or publisher of the image. Full text @ Development