
- Title
-
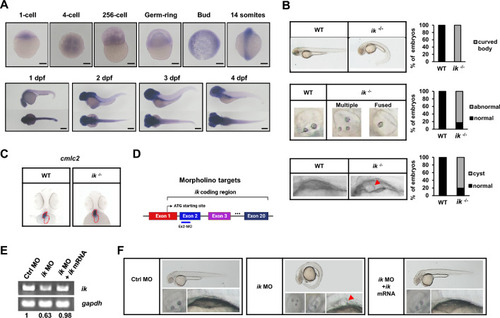
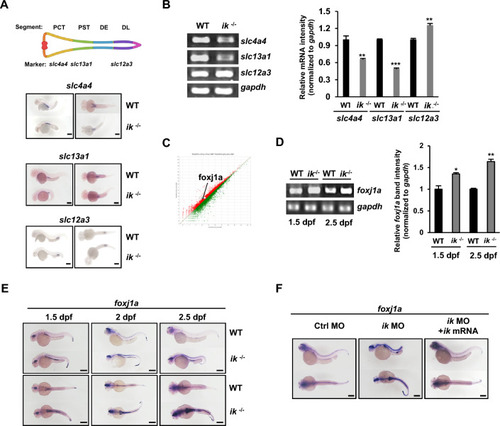
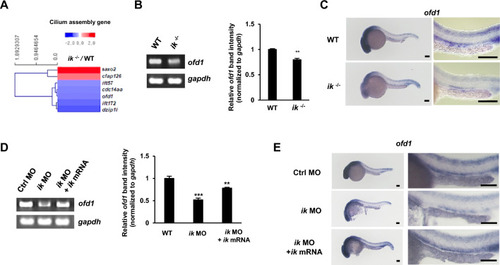
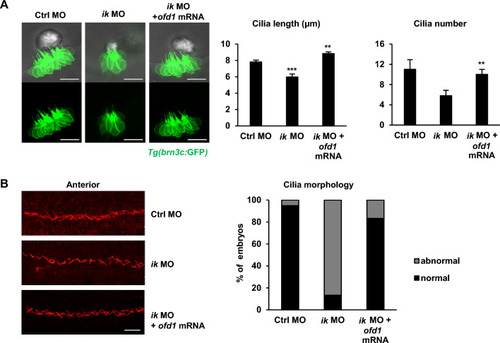
IK is essentially involved in ciliogenesis as an upstream regulator of oral-facial-digital syndrome ciliopathy gene, ofd1
- Authors
- Ka, H.I., Cho, M., Kwon, S.H., Mun, S.H., Han, S., Kim, M.J., Yang, Y.
- Source
- Full text @ Cell Biosci.
zebrafish |
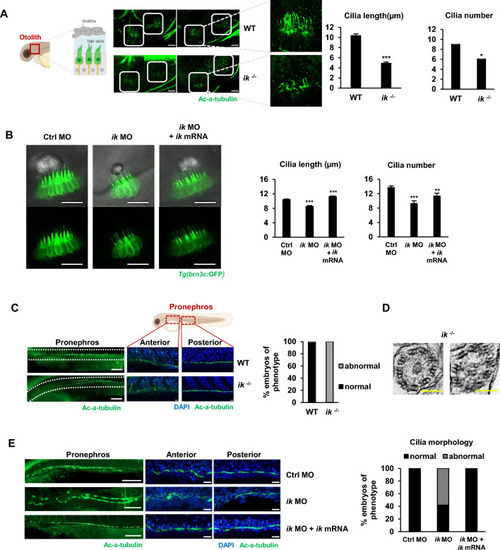
Loss of |
|
|
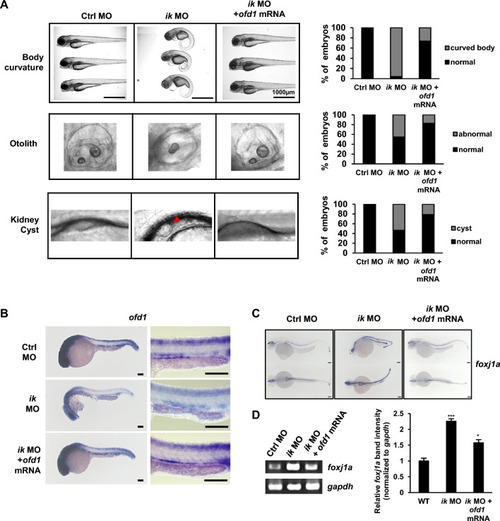
The ciliopathy phenotypes of |
|