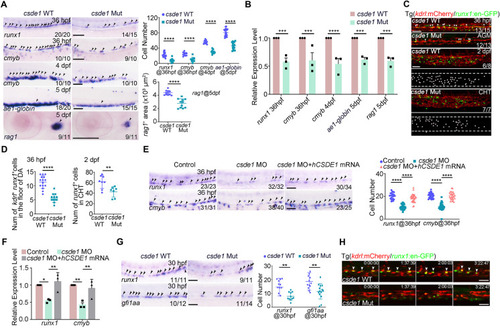
HSPC generation is impaired in csde1 mutants. (A) Expression of HSPC markers runx1 and cmyb (arrowheads) in the AGM region at 36 hpf, cmyb (arrowheads) in the CHT region at 4 dpf, erythroid marker ae1-globin and lymphoid marker rag1 (arrowheads) in the thymus region at 5 dpf in csde1 mutants and WT by WISH, with quantification (right panels). (B) qPCR analysis of runx1, cmyb, ae1-globin and rag1 in csde1 mutants and WT at 36 hpf, 4 dpf or 5 dpf. (C,D) Confocal imaging showing kdrl+runx1+ HECs (white arrowheads) in the AGM region at 36 hpf and runx1+ HSPCs in the CHT region at 2 dpf in csde1 mutants and WT (C) and quantification (D). Dashed lines in C outline the CHT region. (E,F) WISH (E, with quantification, right panel) and qPCR (F) analysis showing that the expression of runx1 and cmyb (arrowheads) at 36 hpf was rescued by hCSDE1 mRNA, compared with csde1 morphants. (G) Examination of the HEC marker runx1 and gfi1aa expression in WT and csde1 mutants at 30 hpf by WISH, with quantification (right panel). (H) Snapshot of EHT (arrowheads) in csde1 mutants and siblings. Data are mean±s.d. *P<0.05, **P<0.01, ***P<0.001, ****P<0.0001 (two-tailed unpaired Student's t-test). n≥3 replicates. Numbers indicate the number of embryos with respective phenotype/total number of embryos analyzed in each experiment (A,C,E,G). Scale bars: 100 μm (A,E,G); 50 μm (C,H).

Csde1 regulates HSPC specification in an EC autonomous manner. (A) WISH analysis showing the expression of runx1 (arrowheads) in WT, csde1 mutants and csde1 mutants injected with hsp70: flag-hCSDE1WT-EGFP or hsp70: flag-hCSDE1DN-EGFP constructs at 36 hpf. (B) Quantification of the WISH data in A. (C) qPCR analysis of runx1 in WT, csde1 mutants and csde1 mutants injected with hsp70: flag-hCSDE1WT-EGFP or hsp70: flag-hCSDE1DN-EGFP constructs at 36 hpf. (D) WISH analysis showing the expression of runx1 (arrowheads) in WT, csde1 mutants and csde1 mutants injected with fli1a: flag-hCSDE1WT-EGFP or fli1a: flag-hCSDE1DN-EGFP constructs at 36 hpf. (E) Quantification of the WISH data in D. (F) qPCR analysis of runx1 in WT, csde1 mutants and csde1 mutants injected with fli1a: flag-hCSDE1WT-EGFP or fli1a: flag-hCSDE1DN-EGFP constructs at 36 hpf. Data are mean±s.d. **P<0.01, ***P<0.001, ****P<0.0001 (two-tailed unpaired Student's t-test). ns, not significant. n≥3 replicates. Numbers indicate the number of embryos with respective phenotype/total number of embryos analyzed in each experiment (A,D). Scale bars: 100 μm.

Wnt signaling is downregulated upon csde1 deficiency. (A) Volcano plots showing the differentially expressed genes in ECs between WT siblings and csde1 mutants. (B) Gene ontology analysis for the downregulated genes in csde1 mutants, compared with WT siblings. (C) GSEA analysis of genes associated with canonical Wnt signaling pathway in csde1 mutants compared with WT siblings. (D) qPCR analysis of Wnt signaling genes cyclin D1, cdk2, axin2, lef1 and tcf3 in ECs in control and csde1 morphants at 36 hpf. Data are mean±s.d. **P<0.01, ***P<0.001 (two-tailed unpaired Student's t-test). n=3 replicates.

Csde1 interacts with ctnnb1 mRNA in ECs. (A) Pie chart depicting the distribution of Csde1 binding peaks. (B) RIP-seq reads distribution of ctnnb1 mRNA compared with control. Blue peaks indicate Csde1 binding sites. (C) RIP-qPCR analysis showing relative mRNA level of ctnnb1 in IgG and anti-Flag groups. Data are mean±s.d. **P<0.01 (two-tailed unpaired Student's t-test). ns, not significant. n=3 replicates. (D) Western blotting showing that endogenous Csde1 protein can be efficiently pulled down by ctnnb1 mRNA compared with anti-sense mRNA probe. (E) Western blotting showing the Flag-hCSDE1 protein from Flag-hCSDE1WT- or Flag-hCSDE1DN-transfected HEK293 cells pulled down with biotin-labeled ctnnb1 probe. (F) The endogenous ctnnb1 mRNA was detected by FISH, and overexpressed EGFP-Csde1 was detected by IF using an EGFP antibody in zebrafish at 36 hpf. The white dotted lines mark DA and CV regions. The bottom panels are magnifications of the dashed boxed areas (upper panels) showing the ECs with colocalization of EGFP-Csde1 and ctnnb1 mRNA (white squares). DA, dorsal aorta; CV, cardinal vein; NC, notochord. Scale bars: 15 μm.

Csde1 is involved in the translational regulation of β-catenin. (A) qPCR analysis of ctnnb1 expression in ECs in control, csde1 morphants and csde1 mutants at 36 hpf. (B) The protein level of β-catenin in control, csde1 morphants and embryos co-injected with csde1 atgMO and hCSDE1 mRNA at 28 hpf. (C) Immunofluorescence showing that nonphosphorylated β-catenin expression in ECs was reduced in csde1 morphants. The white and blue dotted lines mark dorsal aorta and cardinal vein, respectively. The arrowhead denotes nuclear staining in the ECs located in the ventral wall of dorsal aorta. (D) Illustration of the EGFP-ctnnb1 reporter and experimental procedure for reporter assay. (E,F) Representative images (E) and quantification (F) of the relative expression levels of EGFP and EGFP-ctnnb1 with or without csde1 deficiency at the 75% epiboly stage of development. tdTomato mRNA was co-injected into embryos with egfp mRNA or egfp-ctnnb1 mRNA as injection control. (G) qPCR analysis showing the expression of egfp in control embryos and csde1 morphants at the 75% epiboly stage. (H) In vivo transcribed ctnnb1 mRNA pull-down assays followed by immunoblot analysis of anti-Csde1, anti-HA and anti-β-actin in control- and csde1 MO-injected embryos. (I) TOPFlash luciferase reporter assays in ctnnb1 mRNA-injected embryos with or without csde1 atgMO injection. Data are mean±s.d. *P<0.05, ***P<0.001, ****P<0.0001 (two-tailed unpaired Student's t-test). ns, not significant. n≥3 replicates. Numbers indicate the number of embryos with respective phenotype/total number of embryos analyzed in each experiment (E). Scale bars: 15 μm (C); 150 μm (E).

Csde1 regulates Wnt/β-catenin signaling activity to control HSPC generation. (A) Expression of runx1 and cmyb (arrowheads) in the AGM region in WT siblings, csde1 mutants and csde1 mutants injected with fli1a:vp16-tcf7l1ΔN-tdTomato constructs at 36 hpf by WISH (left panels) with quantification (right panel). (B) qPCR showing the expression of runx1, cmyb and Wnt signaling genes at 36 hpf in control embryos, csde1 morphants and csde1 morphants injected with fli1a:vp16-tcf7l1ΔN-tdTomato constructs at 36 hpf. (C) Confocal imaging (left panels) showing that endothelial-derived-tcf7l1ΔN-tdTomato overexpression rescued the population of cmyb+ HSPCs (white arrowheads), compared with csde1 morphants at 36 hpf, with quantification (right panel). Data are mean±s.d. *P<0.05, **P<0.01, ***P<0.001, ****P<0.0001 (two-tailed unpaired Student's t-test). n≥3 replicates. Numbers indicate the number of embryos with respective phenotype/total number of embryos analyzed in each experiment (A,C). Scale bars: 100 μm (A); 50 μm (C).

Schematic showing that Csde1 modulates HSPC development via translational control of ctnnb1 mRNA. Csde1 binds to ctnnb1 mRNA to regulate translation, further enhancing β-catenin protein level and Wnt signal transduction. In the absence of Csde1, the β-catenin protein level is reduced, which results in the downregulation of Wnt signaling, further leading to definitive hematopoiesis defects.

Acknowledgments
This image is the copyrighted work of the attributed author or publisher, and ZFIN has permission only to display this image to its users. Additional permissions should be obtained from the applicable author or publisher of the image. Full text @ Development