
- Title
-
Modular Bioorthogonal Lipid Nanoparticle Modification Platforms for Cardiac Homing
- Authors
- Cruz-Samperio, R., Hicks, C.L., Scott, A., Gispert Contamina, I., Elani, Y., Richardson, R.J., Perriman, A.W.
- Source
- Full text @ J. Am. Chem. Soc.
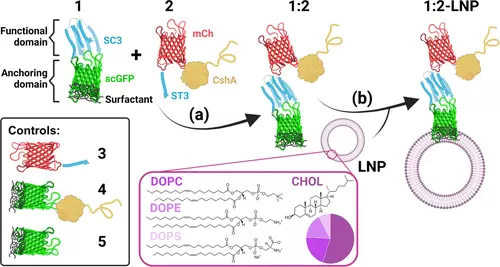
Synthesis of cardiac-homing lipid nanoparticles. (a) Reaction between protein reactive pairs to generate a modular artificial membrane-binding protein (AMBP). Protein fusion 1, consisting of SpyCatcher (SC3, shown in blue) and supercharged green fluorescent protein (scGFP, shown in green), reacts bioorthogonally with protein fusion 2, consisting of SpyTag (ST3, shown in blue), mCherry (mCh, shown in red), and the fibronectin-binding protein CshA (shown in yellow), forming an isopeptide bond through the side chains of SC3 Lys28 and ST3 Asp10. An additional protein fusion 3, consisting of mCh and ST3 was generated as a negative control of cardiac homing. Other negative controls were protein fusions 4, consisting of cardiac-homing protein CshA fused to the scGFP-anchoring domain, and 5, consisting of just the anchoring domain. (b) Cardiac-homing (CH) lipid nanoparticle (LNP), 1:2-LNP, is ensembled upon mixing of the modular AMBP and our in-house LNPs made of cholesterol (CHOL, 58% v/v), 2-dioleoyl-sn-glycero-3-phosphocholine (DOPC, 22% v/v), 1,2-dioleoyl-sn-glycero-3-phosphoethanolamine (DOPE, 16% v/v), and 1,2-dioleoyl-sn-glycero-3-phospho-l-serine (DOPS, 8% v/v). The figure was created using BioRender.com. |
Characterization of reaction between protein constructs containing SpyCatcher and SpyTag. (a) SDS-PAGE monitoring of the reaction between 1 (10 μM [SC3-scGFP][S], ca. 42.5 kDa) and 2 (10 μM CshA-mCh-ST3, ca. 112 kDa) to yield 1:2 (CshA-mCh-ST3-[SC3-scGFP][S], ca. 155 kDa). (b) Pair-distance distribution function P(r) calculated using ScÅtter from synchrotron radiation small-angle X-ray scattering (SR-SAXS) data of 1 (shown in gray, χ2 = 1.396), 2 (shown in yellow, χ2 = 1.255), and the reaction product between both 1:2 (shown in light blue, χ2 = 1.292). (c) Pair-distance distribution function P(r) calculated using ScÅtter from synchrotron radiation small-angle X-ray scattering (SR-SAXS) data of 1, 3 (mCh-ST3, shown in purple, χ2 = 1.110), and the reaction product between both 1:3 (mCh-ST3-[SC3-scGFP][S], shown in navy blue, χ2 = 1.245). (d–h) Overlay of protein crystal structures and ab initio bead models computed from the SR-SXS data of (d) reaction product of CshA-mCh-ST3 and [SC3-scGFP][S] (1:2, bead model shown in cyan), (e) reaction product of mCh-ST3 and [SC3-scGFP][S] (1:3, bead model shown in navy blue), (f) [SC3-scGFP][S] (1, bead model shown in gray), (g) CshA-mCh-ST3 (2, bead model shown in orange), (h) mCh-ST3 (3, bead model shown in purple), and (i) SC3-scGFP (bead model shown in green). Proteins were modeled with I-TASSER, (32−34) and the models were selected depending on the known structures of SC3–ST3 (shown in navy blue), sfGFP (shown in green), and mCherry (shown in yellow). I-Tasser model C-scores: (d) −3.45, (e) −2.62, (f–i) −2.62, (g) −4.05, and (h) −0.62. |
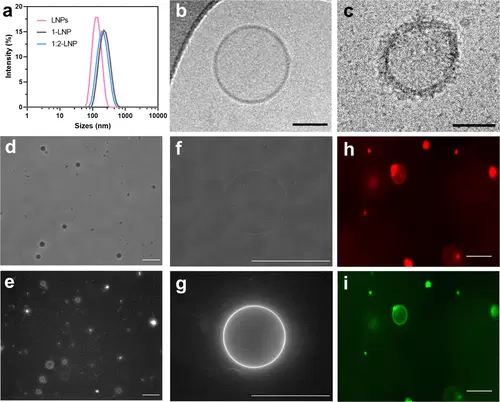
Characterization of LNPs and their modification with AMBPs. (a) Dynamic light scattering (DLS) of native LNPs (approximately 1.5 × 10¹² LNPs/mL) or AMBP-modified LNPs (10 μM AMBP concentration, 100 μL protein per 1 mL of LNPs). (b) Cryo-TEM images of unmodified LNPs (approximately 1.5 × 10¹³ LNPs/mL) and (c) 1:2-LNPs (approximately 1.5 × 10¹³ LNPs/mL) showing successful membrane modification. Scale bars: 50 nm. (d) Phase-contrast microscopy image of giant unilamellar vesicles (GUVs) after an overnight reaction with 2 μL of 4 (10 μM). (e) Fluorescence microscopy image of GFP from (d). (f) Phase-contrast image of a single GUV modified with 4. (g) GFP fluorescence microscopy image of (f). (h) Fluorescence microscopy images (GUVs) labeled with Texas red (shown in red) and after addition of 2 μL of 5 (10 μM). (i) GFP channel of (h), shown in green. GUVs were composed of CHOL, DOPC (5% TR-DHPE only in (h) and (i)) DOPS, and DOPE in a 55:21:16:8% ratio, and lipid films were hydrated in 0.5 M sucrose and imaged in 0.5 M glucose (both in 20 mM phosphate buffer at pH 7.5). Scale bars: 50 μm. |

Characterization of AMBP-modified LNPs interaction with C2C12 myoblasts. Confocal images of C2C12 cells (250 000 cells/dish) after exposure to (a) Texas red (TR)-labeled 4-LNPs, (b) mCherry-loaded 4-LNPs, (c) 1-LNPs, (d) 1:2-LNPs, and (e) 1:3-LNPs (approximately 1.5 × 10¹¹ LNPs). GFP is shown in green, and mCherry or Texas red is shown in red. Scale bars: a–b, 25 μm; c–e, 50 μm. (f) Flow cytometry quantification of GFP (shown in green) and mCherry (shown in red) in C2C12 cells after 2 h of incubation with mCherry-loaded LNPs (n = 15) or (g) LNPs modified with protein fusions 1, 1:2, and 1:3 (n = 12). Box and whiskers plots display min to max error bars and data points. Each data point is the mean of fluorescence of 10 000 events. Multiple unpair t tests are displayed as n.s. for nonsignificance, **p < 0.01 and ****p < 0.0001. (h) Cell viability of C2C12 myoblasts (50 000 cells/well, 96-well plate) over 7 days after exposing them to different conditions (20 μL of 1 μM proteins or approximately 1.5 x 10¹⁰ vesicles) for 2 h. Cell viability (n = 3) was calculated via extrapolation of the fluorescence data obtained from the Alamar Blue (AB) metabolic activity assay from a previously calculated standard curve. The mean and standard deviation are reported. LNP diagrams were created with Biorender.com. |
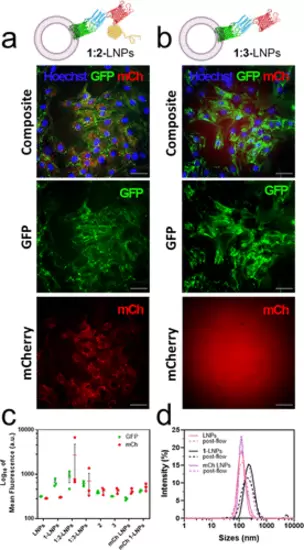
Characterization of AMBP-modified LNPs interaction with C2C12 myoblasts in flow. (a) End-point wide-field microscopy image of C2C12s cells in a flow channel after exposure with 1:2-LNPs or (b) 1:3-LNPs (250,000 cells per flow channel, approximately 1.5 × 10¹¹ vesicles in 25 mL of DMEM) at a shear stress of 2 dyn for 15 min at 37 °C. GFP is shown in green, mCherry or Texas red is shown in red, and Hoechst 33342 is shown in blue. Scale bars: 50 μm. (c) Flow cytometry quantification of GFP (shown in green) and mCherry (shown in red) in C2C12 cells after the flow experiment (n = 3). Plot displays the mean ± SEM, and data points are shown. Each data point is the mean of fluorescence of 10,000 single-cell events. (d) DLS intensity data of 1-LNPs before and after exposure to 2 dyn stress shear showing that they maintain their size. LNP diagrams were created with Biorender.com. |

Live imaging of proteins and modified LNPs in the peripheral circulation of 2 days postfertilization larval zebrafish. Modified LNPs (2 nL, approximately 3 × 10⁶ vesicles) or control proteins (2 nL, 30 μM) were injected into the duct of Cuvier and monitored in the heart, in the arterial environment of the dorsal aorta (DA), and in venous vessels in the caudal vein plexus (CVP). Live imaging was performed on a Leica TCS SP8 AOBS confocal laser scanning microscope. GFP is shown in green, and mCherry is shown in red. The images shown are representative of each condition. Scale bars: 50 μm for the heart, 10 μm for DA and CVP images. |
|