
- Title
-
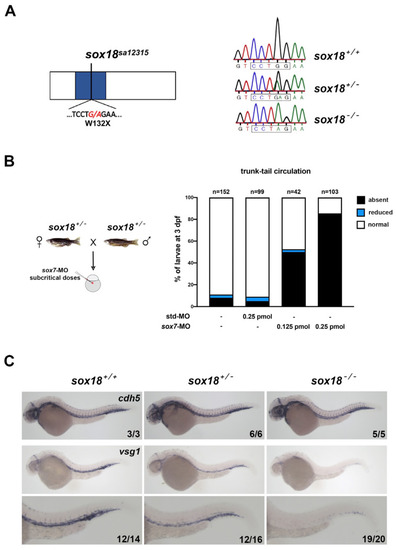
Lymphatic Defects in Zebrafish sox18 Mutants Are Exacerbated by Perturbed VEGFC Signaling, While Masked by Elevated sox7 Expression
- Authors
- Moleri, S., Mercurio, S., Pezzotta, A., D'Angelo, D., Brix, A., Plebani, A., Lini, G., Di Fuorti, M., Beltrame, M.
- Source
- Full text @ Cells
The EXPRESSION / LABELING:
PHENOTYPE:
|
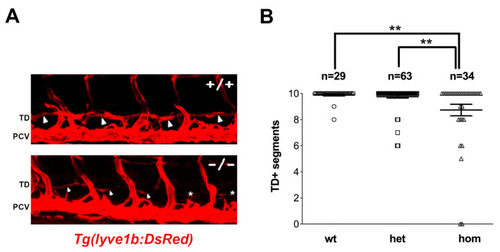
Homozygous PHENOTYPE:
|

TD formation defects are exacerbated upon slight perturbation of Vegfc signaling. The progeny of PHENOTYPE:
|
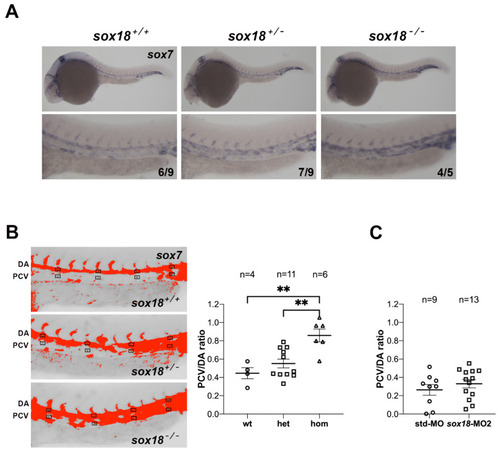
The expression of |

ZFIN is incorporating published figure images and captions as part of an ongoing project. Figures from some publications have not yet been curated, or are not available for display because of copyright restrictions. PHENOTYPE:
|
|
ZFIN is incorporating published figure images and captions as part of an ongoing project. Figures from some publications have not yet been curated, or are not available for display because of copyright restrictions. |
|
ZFIN is incorporating published figure images and captions as part of an ongoing project. Figures from some publications have not yet been curated, or are not available for display because of copyright restrictions. EXPRESSION / LABELING:
|
|
ZFIN is incorporating published figure images and captions as part of an ongoing project. Figures from some publications have not yet been curated, or are not available for display because of copyright restrictions. EXPRESSION / LABELING:
|