FIGURE SUMMARY
Title

Inhibition of mitochondrial fatty acid β-oxidation activates mTORC1 pathway and protein synthesis via Gcn5-dependent acetylation of raptor in zebrafish

Authors
Zhou, W.H., Luo, Y., Li, R.X., Degrace, P., Jourdan, T., Qiao, F., Chen, L.Q., Zhang, M.L., Du, Z.Y.
Source
Full text @ J. Biol. Chem.

Mitochondrial FAO inhibition activates the mTORC1 pathway and increases protein synthesis in zebrafish.A, isotope tracer analysis (PA∗, [1–14C] palmitic acid) to assess mitochondrial FAO efficiency in liver and muscle tissues. N = 6. BE, the effects of mitochondrial FAO inhibition by mildronate (MD) on muscle protein content (B, n = 5), carcass protein content (C, n = 5), whole body protein content (D, n = 5), and carcass ratio (CR) (E, n = 9) in zebrafish. CR = 100 × (carcass weight/body weight). The carcass is mainly muscle tissue. F and G, the mTORC1 activity in liver (F) and muscle (G) tissues was detected by Western blotting for key proteins of the mTORC1 pathway. p indicates phosphorylated protein. Liver and muscle tissues were lysed, and Western blots for p-mTORSer2448, p-S6kThr389, S6k, p-S6Ser235/236, and S6 are shown. N = 3. H, metabolic tracking of [1–14C]-PA and l-[14C (U)]-AA in zebrafish-fed CN and MD diets for 6 weeks (H). N = 6. Data represent mean ± SD. ∗p < 0.05 and ∗∗p < 0.01. AA, amino acid; CN, control; FAO, fatty acid oxidation; mTORC1, mechanistic target of rapamycin complex 1.

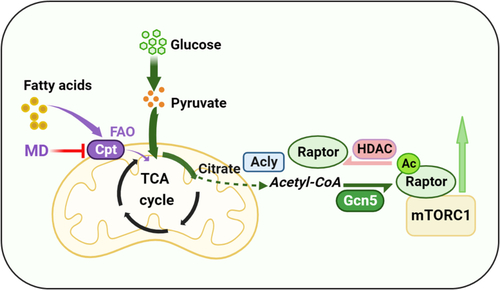
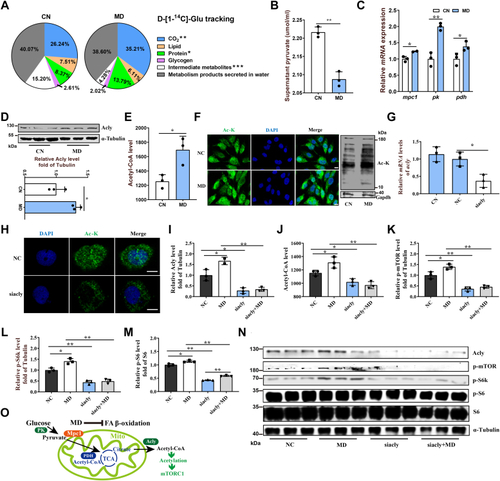
Mitochondrial FAO inhibition increases cytoplasmic glucose-derived acetyl-CoA levels and protein acetylation–mediated mTORC1 activation.A, metabolic tracking of d-[1–14C] glucose in zebrafish-fed CN and MD diets for 6 weeks (H). N = 6. B, the pyruvate content in ZFL cell culture supernatant. N = 3. The concentration and time of MD-treated cells were 1 mM and 48 h (the same below). C, relative mRNA levels of key regulatory genes (mpc1, pk [pyruvate kinase] and, pdh [pyruvate dehydrogenase]) for glucose-derived acetyl-CoA production in ZFL cells. N = 3. D and E, the protein expression levels of Acly (D; N = 3) and intracellular acetyl-CoA levels (E; N = 3) in ZFL cells. F, immunofluorescence (left) and Western blotting (right) of the global protein lysine acetylation in ZFL cells. Ac-K indicates protein lysine acetylation. Scale bars represent 10 μm. N = 3. G, relative mRNA levels of acly (ATP citrate lyase) in CN, NC, and acly siRNA-treated cells. N = 3. H, immunofluorescence of the global protein lysine acetylation in acly siRNA-treated ZFL cells. Scale bars represent 5 μm. N = 3. I, the protein expression levels of Acly were quantified after NC and MD cells were treated with acly siRNA for 48 h. N = 3. J, the intracellular acetyl-CoA levels were quantified after NC and MD cells were treated with acly siRNA for 48 h. N = 3. KM, the effect of acly knockdown on mTORC1 signaling caused by mitochondrial FAO inhibition. NC and MD cells were treated with acly siRNA for 48 h. Relative protein quantification of p-mTOR/tubulin (K), p-S6k/tubulin (L), and p-S6/S6 (M) in ZFL cells. N = 3. N, the Western blots for Acly, p-mTORSer2448, p-S6kThr389, p-S6Ser235/236, and S6 are shown. N = 3. O, mitochondrial FAO inhibition increases glucose-derived acetyl-CoA production, which in turn promotes cytoplasmic protein acetylation-mediated mTORC1 activation. Data represent mean ± SD. ∗p < 0.05 and ∗∗p < 0.01. Acly, ATP citrate lyase; CN, control; FAO, fatty acid oxidation; MD, mildronate; mTORC1, mechanistic target of rapamycin complex 1; NC, negative control; ZFL, zebrafish liver.

Mitochondrial FAO inhibition activates mTORC1 activity dependent on Raptor acetylation.A, immunoprecipitation of Raptor followed by detection of Raptor acetylation levels with antilysine acetylation antibody in CN- and MD-treated ZFL cells after 48 h. N = 3. B, immunoprecipitation of Raptor followed by detection of Raptor acetylation levels with antilysine acetylation antibody. The NC, MD, acly siRNA, and MD with acly siRNA–treated cells were lysed and Western blots for Raptor acetylation. N = 3. C, subcellular localization of Raptor and lysine-acetylated proteins in NC, MD, acly siRNA, and MD with acly siRNA–treated cells after 48 h. Scale bars represent 5 μm. D, relative mRNA levels of Raptor in CN, negative control (NC), and raptor siRNA–treated ZFL cells. N = 5. EI, the effect of raptor knockdown on mTORC1 signaling caused by mitochondrial FAO inhibition. NC and MD cells were treated with raptor siRNA for 48 h. Relative protein quantification of Raptor/tubulin (F), p-mTOR/tubulin (G), p-S6k/tubulin (H), and p-S6/S6 (I) in ZFL cells. Cells were lysed, and Western blots for Raptor, p-mTORSer2448, p-S6kThr389, p-S6Ser235/236, and S6 are shown (E). N = 3. Data represent mean ± SD. ∗p < 0.05 and ∗∗p < 0.01. Ac-Raptor, lysine acetylation of Raptor; CN, control; FAO, fatty acid oxidation; MD, mildronate; mTORC1, mechanistic target of rapamycin complex 1; NC, negative control; T-Raptor, total Raptor; ZFL, zebrafish liver.

Mitochondrial FAO inhibition activates the mTORC1 pathway dependent on the acetyltransferase Gcn5.A, the effects of mitochondrial FAO inhibition on mRNA expression levels of acetyltransferase family related genes in ZFL cells. As shown in the heat map. N = 5. B, the effects of mitochondrial FAO inhibition on the protein expression levels of key acetyltransferases P300, Gcn5, and Pcaf in ZFL cells. N = 3. C, the effect of Gcn5 inhibitor (CPTH6, 1 μM) treatment on mTORC1 activity (p-S6kThr389 and p-S6Ser235/236) caused by mitochondrial FAO inhibition. The CN- (normal medium), MD- (normal medium containing 1 mM MD), and MD + CPTH6- (normal medium containing 1 mM MD and 1 μM CPTH6) treated cells were lysed and Western blotted after 48 h. N = 3. D, the 3D spatial structures of zebrafish Gcn5 and Raptor were obtained from SWISS-MODE and the predicted binding complex model of Raptor–Gcn5 by using the PDBePISA online protein docking tool. Note: different atoms are marked with different colors, gray is hydrogen, green is carbon, red is oxygen, and blue is nitrogen. E, the interface area and free energy of the predicted complex was analyzed and shown in the table. The larger the interface area implies the easier the proteins bind to each other. Negative free energy indicates that the protein can bind stably. F, immunoprecipitation reflects the protein interactions between Raptor and Gcn5 in ZFL cells. Data represent mean ± SD. ∗p < 0.05 and ∗∗p < 0.01. CN, control; FAO, fatty acid oxidation; Gcn5, general control nondepressible 5; MD, mildronate; mTORC1, mechanistic target of rapamycin complex 1; Pcaf, P300/Creb-binding protein–associated factor; ZFL, zebrafish liver.

Acetyltransferase Gcn5 mediates the regulation of Raptor acetylation in ZFL cells.AC, the effects of Gcn5 siRNA treatment on global protein lysine acetylation (A), protein quantification of acetyltransferase (P300, Gcn5, and Pcaf) (B), and Raptor acetylation (C). Scale bars represent 5 μm. N = 3. D, the effects of gcn5 siRNA treatment on mTORC1 activity (p-S6Ser235/236 and p-4EBPThr37/46) in ZFL cells. N = 3. E, the effect of gcn5 siRNA treatment on cell growth performance in ZFL cells. N = 3. F, the effect of CPTH6 treatment on the relative growth rate of ZFL cells. N = 7. Data represent mean ± SD. ∗p < 0.05 and ∗∗p < 0.01. Gcn5, general control nondepressible 5; mTORC1, mechanistic target of rapamycin complex 1; Pcaf, P300/Creb-binding protein–associated factor; ZFL, zebrafish liver.

Deacetylase HDAC mediates Raptor acetylation and mTORC1 pathway regulation.A, immunofluorescence and Western blotting of the global protein lysine acetylation in CN and HDAC inhibitor (trichostatin A [TSA]: 10 μM) treated ZFL cells. Scale bars represent 5 μm. N = 3. B, the effects of deacetylase SIRT inhibition (nicotinamide [NAM]: 0, 1, and 5 μM) on global protein lysine acetylation in ZFL cells. N = 3. C, Raptor acetylation in CN- and TSA-treated ZFL cells. N = 3. D, Raptor acetylation in CN- and NAM- (5 μM) treated ZFL cells. N = 3. E, mTORC1 activity (p-mTORSer2448, p-S6kThr389, and p-S6Ser235/236) in CN- and TSA-treated ZFL cells. N = 3. F, the effects of mitochondrial FAO inhibition (MD treatment) on mRNA expression levels of class IIa HDAC-related genes in ZFL cells. N = 3. Data represent mean ± SD. ∗p < 0.05 and ∗∗p < 0.01. CN, control; HDAC, histone deacetylase; MD, mildronate; mTORC1, mechanistic target of rapamycin complex 1; SIRT, sirtuin deacetylase; ZFL, zebrafish liver.

Schematic model: mitochondrial fatty acid β-oxidation inhibition activates the mTORC1 pathway by promoting glucose catabolism and subsequent Gcn5-dependent Raptor acetylation. Ac, acetyl; Gcn5, general control nondepressible 5; mTORC1, mechanistic target of rapamycin complex 1; TCA, tricarboxylic acid.

Acknowledgments
This image is the copyrighted work of the attributed author or publisher, and ZFIN has permission only to display this image to its users. Additional permissions should be obtained from the applicable author or publisher of the image. Full text @ J. Biol. Chem.