
IMAGE
Figure 7
- ID
- ZDB-IMAGE-231002-328
- Publication
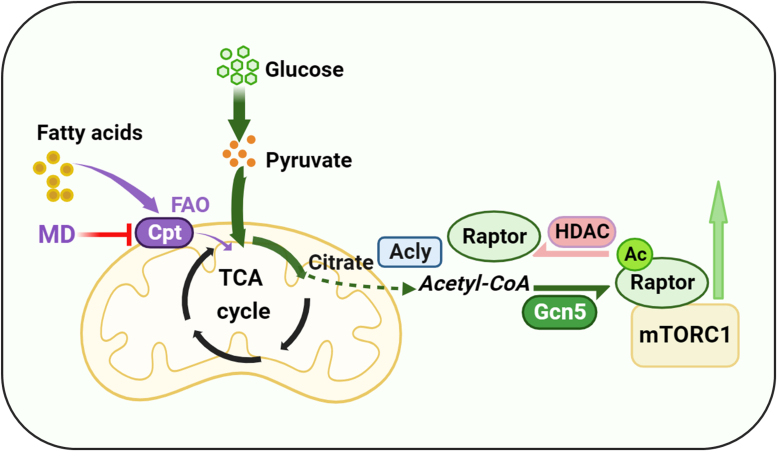
- Zhou et al., 2023 - Inhibition of mitochondrial fatty acid β-oxidation activates mTORC1 pathway and protein synthesis via Gcn5-dependent acetylation of raptor in zebrafish
- All Figures
- Figures for Zhou et al., 2023
Image
|
Figure Caption
Figure 7
Acknowledgments
This image is the copyrighted work of the attributed author or publisher, and
ZFIN has permission only to display this image to its users.
Additional permissions should be obtained from the applicable author or publisher of the image.
Full text @ J. Biol. Chem.