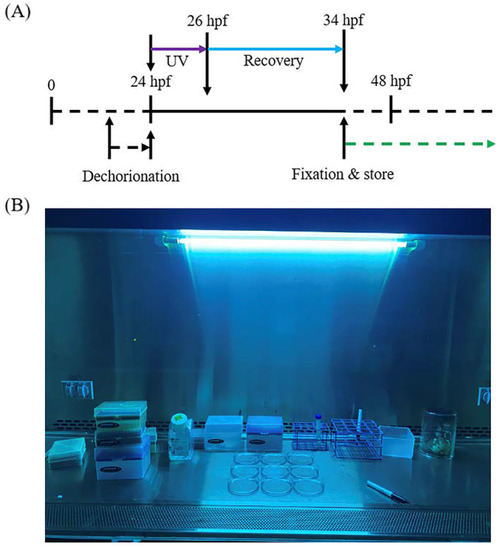
Zebrafish embryo Caspase-3 cleavage activation and sample preparation. A The schedule for the zebrafish embryo Caspase-3 cleavage activation treatments and sample preparation. B The image showing the dechorionated zebrafish embryos were under UV treatment inside the biosafety cabinet

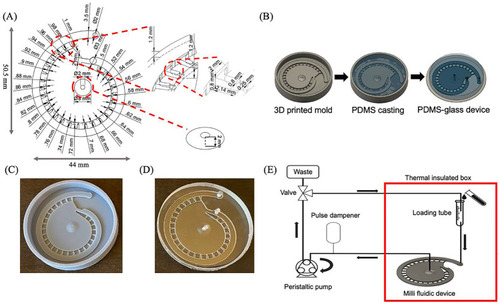
Multi-depth spiral milli fluidic device for zebrafish immobilization and antibody staining. A The engineering drawing showing the dimension of the multi-depth spiral device. B The 3D printing assisted prototyping process. C Photography showing the 3D printed negative master mold for the multi-depth spiral device. D Photography showing the assembled PDMS-glass device after soft lithography. E Schematic showing the system setups. The arrows indicate the flow directions

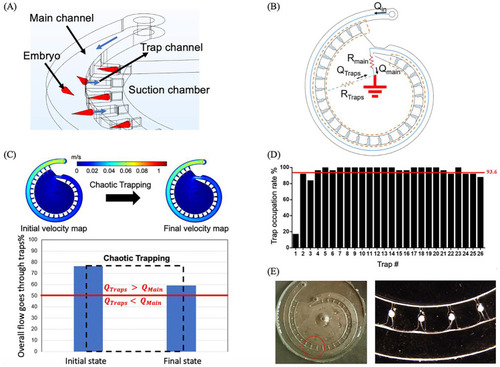
The zebrafish embryo trapping principles and validations. A The schematic showing the torpedo-shaped embryos are dragged into the traps due to the hydrodynamic suction force. B The simplified circular analogy for the multi-depth spiral device showing the parallel trapping and source and sink configurations for the design. C The CFD simulations for initial and final fluidic conditions for the trapping process. The possibility for the embryo trapping retains during the trapping process as the overall flowrate goes through the traps is always higher than the flowrate passes through the main channel. Inlet flowrate is set to be 10 ml/min. D The trap occupation rate for each individual traps (N= 24, n=624). The red line indicates the overall average trap occupation rate. 36 hpf UV treated embryo with body length around 2 mm are used in the trapping validation experiments. E Microscopy images showing the zebrafish embryos are encapsulated by the PBST droplets inside the traps due to the presence of the Laplace pressure

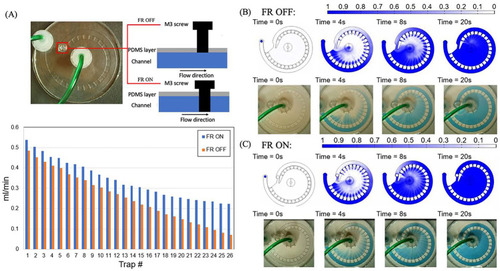
On-chip flow settings for the multi-depth spiral device. A Top: The flow restrictor (FR) ON and OFF modes for the device. Bottom: The flowrates at each individual traps at FR ON (blue) and FR OFF (orange) modes. B The perfusion simulation (top) and validation (bottom) for FR OFF mode at 10 ml/min inlet flowrate. C The perfusion simulation (top) and validation (bottom) for the FR ON mode at 10 ml/min inlet flowrate

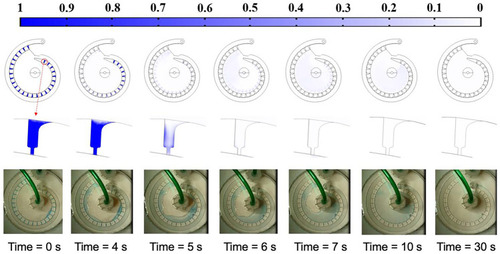
The flushing time estimation. Top panel: the overall mass transfer simulation for the flushing process. Middle panel: mass transfer simulation for the last trap (i.e., 26th trap) during open-loop flushing. Bottom panel: the flushing validation experiment using methylene blue/PBST. The flushing flowrate for both simulation and experiment are 10 ml/min

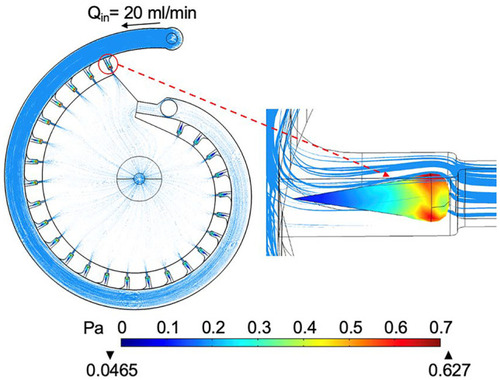
The simulated body shear stress on the fixed zebrafish embryos during on-chip perfusion. The embryo in the first trap is selected to show the maximum shear stress level and the shear stress distribution. The flowrate is set at 20 ml/min and the FR is turned on

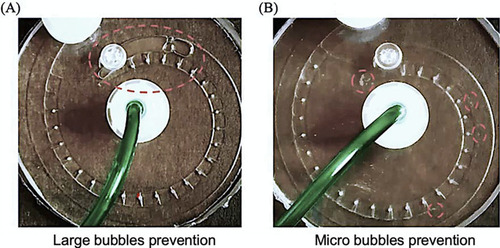
Bubble prevention in the milli fluidic device. A The large bubble formed during buffer switching can be easily flushed out by increasing the flowrate or slightly tilting the device. B The micro bubbles formed at high perfusion flowrates are traveling near the top surface of the main channel and not entering the traps due to the channel height difference

Acknowledgments
This image is the copyrighted work of the attributed author or publisher, and ZFIN has permission only to display this image to its users. Additional permissions should be obtained from the applicable author or publisher of the image. Full text @ Biomed. Microdevices.