IMAGE

Fig. 5

ID
ZDB-IMAGE-230817-5
Source
Figures for Ye et al., 2023
Image
Figure Caption

Fig. 5

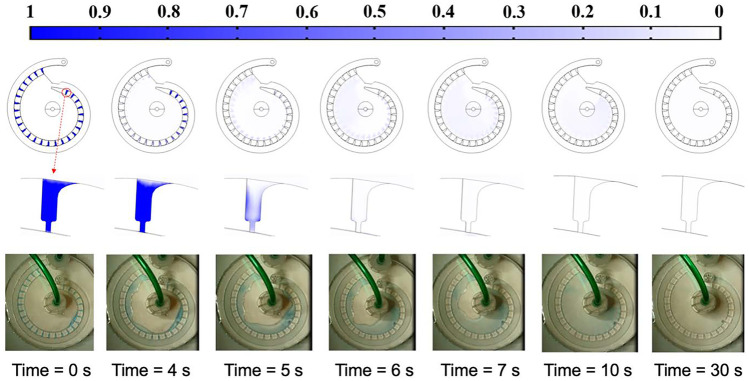
The flushing time estimation. Top panel: the overall mass transfer simulation for the flushing process. Middle panel: mass transfer simulation for the last trap (i.e., 26th trap) during open-loop flushing. Bottom panel: the flushing validation experiment using methylene blue/PBST. The flushing flowrate for both simulation and experiment are 10 ml/min

Acknowledgments
This image is the copyrighted work of the attributed author or publisher, and ZFIN has permission only to display this image to its users. Additional permissions should be obtained from the applicable author or publisher of the image. Full text @ Biomed. Microdevices.