- Title
-
Biliary atresia is associated with polygenic susceptibility in ciliogenesis and planar polarity effector genes
- Authors
- Glessner, J.T., Ningappa, M.B., Ngo, K.A., Zahid, M., So, J., Higgs, B.W., Sleiman, P.M.A., Narayanan, T., Ranganathan, S., March, M., Prasadan, K., Vaccaro, C., Reyes-Mugica, M., Velazquez, J., Salgado, C.M., Ebrahimkhani, M.R., Schmitt, L., Rajasundaram, D., Paul, M., Pellegrino, R., Gittes, G.K., Li, D., Wang, X., Billings, J., Squires, R., Ashokkumar, C., Sharif, K., Kelly, D., Dhawan, A., Horslen, S., Lo, C.W., Shin, D., Subramaniam, S., Hakonarson, H., Sindhi, R.
- Source
- Full text @ J. Hepatol.
|
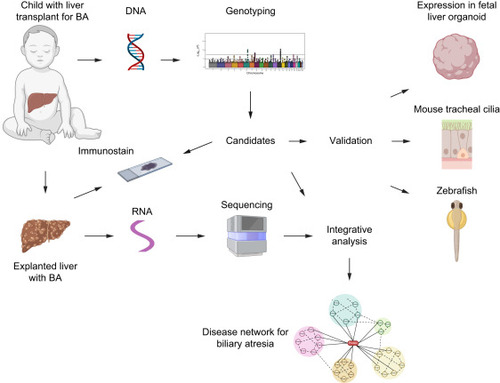
Study design. BA-associated common SNPs were identified using GWAS in 811 BA cases and 4,654 controls. Candidate genes underwent functional validation with immunostaining, fetal liver organoids, mouse tracheal cilia, and zebrafish. Whole-transcriptome sequencing was performed on 64 BA livers and eight normal donor liver samples. An integrative analysis was performed using genes identified by GWAS and differentially expressed genes in BA livers. BA, biliary atresia, GWAS, genome-wide association study; SNPs, single nucleotide polymorphisms. |
|
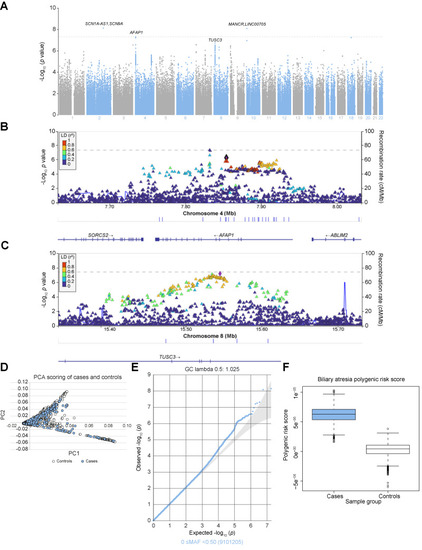
Genome-wide association study. (A-C) Genome-wide (A) and regional Manhattan plots (B and C) indicate robust genome-wide association signals for the AFAP1 (B) and TUSC3 (C) loci. Each locus shows a lead SNP (purple diamond) coupled with elevated significance of SNPs in linkage disequilibrium and flanking SNPs with low significance (dark blue dots). (D) PCA plot for cases (blue) and controls (orange). (E) Q-Q plot for association results. (F) Polygenic risk score distribution in cases and controls. PCA, principal component analysis; SNPs, single nucleotide polymorphisms. |
|
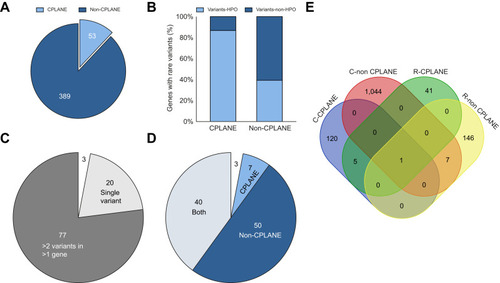
Rare variants in BA. (A) CPLANE and non-CPLANE genes with rare variants. (B) Proportions of CPLANE and non-CPLANE genes in Fig 2A, with rare variants which are associated with HPO terms. (C) BA cases with no rare variants (n = 3), single rare variants (light grey) and multiple rare variants (dark grey). (D) Distribution of CPLANE and non-CPLANE genes, and genes in both categories with rare variants among BA cases. (E) Venn diagram shows overlap between CPLANE and non-CPLANE genes with rare and common variants. BA, biliary atresia; CPLANE, ciliogenesis and planar polarity effector; HPO, Human Phenotype Ontology. |
|
Single-cell RNA-sequencing and immunostaining. (A) Single-cell RNA-sequencing data from inducible pluripotent stem cell-derived human fetal liver organoids. Spindle plots show expression of AFAP1 (upper panel) and TUSC3 (lower panel) in progenitors of hepatocytes, biliary epithelial cells, stellate cells and endothelial cells (H, BEC, Stel, EC, respectively). Expression of both genes is enriched in BEC and Stel populations. (B) Immunoperoxidase staining shows expression of AFAP1 (upper panels) and TUSC3 (lower panels) in 18-week-old human fetal liver, normal human liver, and liver samples from individuals with biliary atresia and disease controls (primary familial intrahepatic cholestasis type 1, PFIC1). AFAP1 staining is predominantly seen in cholangiocytes. TUSC3 staining is more diffuse, in cholangiocytes, endothelial cells and other cells. |
|
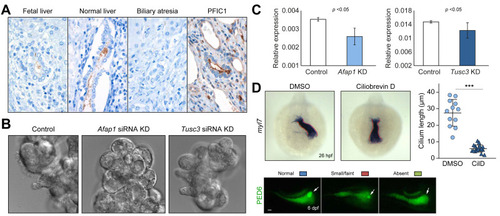
(A) Immunoperoxidase staining of Arl13b, which is expressed in primary or motile cilia shows luminal staining in 18-week-old human fetal liver, normal human liver, and liver disease-control (primary familial intrahepatic cholestasis type 1, PFIC1). Arl13b staining is absent in livers with BA. (B) Panels from left to right show mouse tracheal cell cultures before (left) and after treatment with Afap1 siRNA and Tusc3 siRNA. Treated cultures do not demonstrate the normal distribution of motile cilia seen in untreated cultures (Video S1). (C) The relative expression of Afap1 and Tusc3 in mouse tracheal epithelia cell cultures shows the effectiveness of KD after siRNA transfection (Video S2 and Video S3). (D) CilD treatment impairs left-right asymmetry and hepatic biliary function in zebrafish. Upper left. Whole-mount in situ hybridization images showing myl7 expression in cardiomyocytes at 26 hpf. The embryos were treated with 5 μM CilD from 8 to 26 hpf. Dotted lines outline the heart. Two patterns of heart looping (normal and midline) were observed. Lower left panels. Epifluorescence images showing PED-6 accumulation in the gallbladder (arrowheads). The larvae were treated with 2.5 μM CilD from 3 to 6 dpf. Based on PED6 levels in the gallbladder, larvae were divided into three groups: normal, small/faint, and absent. Right panel. The length of cilium in cholangiocytes was significantly reduced in CilD-treated larvae (n = 6) compared to controls (n = 4) at 6 dpf. CilD, ciliobrevin D; Dpf, days post fertilization; Hpf, hours post fertilization; KD, knockdown; siRNA, small-interfering RNA. |
|
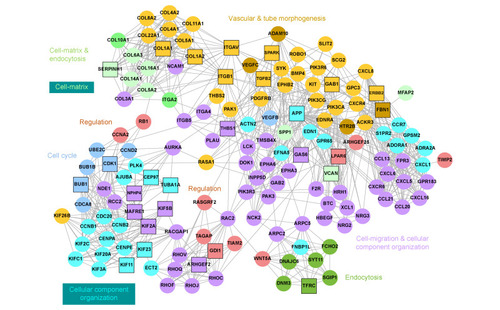
Protein-protein interaction network of 149 highly connected nodes with ≥6 interactions identified in integrative analysis of RNA-sequencing and GWAS genes. Target genes were upregulated in the BA transcriptome and selected from among 1,389 genes including 102 BA-associated CPLANE genes and genes in proximity to SNPs with significant differences between 811 BA cases and 4,654 controls (p <0.0001) and the first neighbors of these gene sets in the STRING database. These genes were present in significant gene ontology biological processes (adjusted p value <0.01). Node colors indicate the biological processes associated with the genes. Rectangular outlines identify CPLANE genes. Details for 149 network genes and associated pathways are provided in Tables S12-S15. BA, biliary atresia; GWAS, genome-wide association study. BA, biliary atresia, CPLANE, ciliogenesis and planar polarity effector; GWAS, genome-wide association study; SNPs, single nucleotide polymorphisms. |
Reprinted from Journal of hepatology, 79(6), Glessner, J.T., Ningappa, M.B., Ngo, K.A., Zahid, M., So, J., Higgs, B.W., Sleiman, P.M.A., Narayanan, T., Ranganathan, S., March, M., Prasadan, K., Vaccaro, C., Reyes-Mugica, M., Velazquez, J., Salgado, C.M., Ebrahimkhani, M.R., Schmitt, L., Rajasundaram, D., Paul, M., Pellegrino, R., Gittes, G.K., Li, D., Wang, X., Billings, J., Squires, R., Ashokkumar, C., Sharif, K., Kelly, D., Dhawan, A., Horslen, S., Lo, C.W., Shin, D., Subramaniam, S., Hakonarson, H., Sindhi, R., Biliary atresia is associated with polygenic susceptibility in ciliogenesis and planar polarity effector genes, 1385-1395, Copyright (2023) with permission from Elsevier. Full text @ J. Hepatol.

