
Image
|
Figure Caption
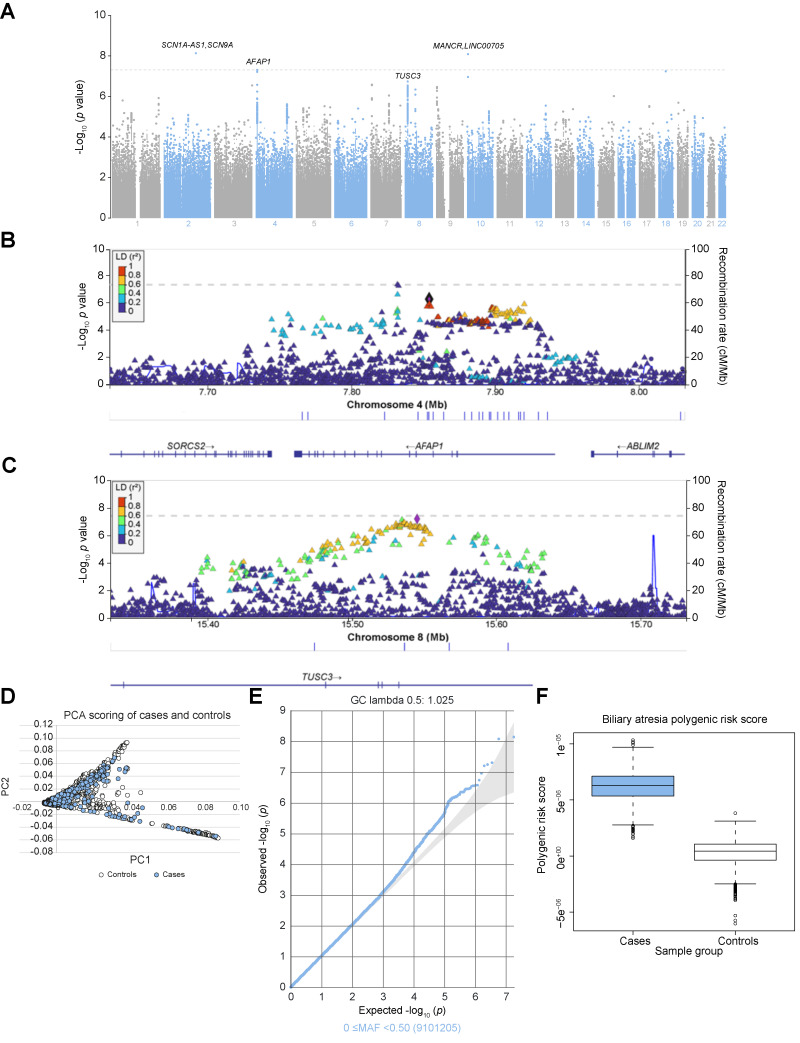
Fig. 2 Genome-wide association study. (A-C) Genome-wide (A) and regional Manhattan plots (B and C) indicate robust genome-wide association signals for the AFAP1 (B) and TUSC3 (C) loci. Each locus shows a lead SNP (purple diamond) coupled with elevated significance of SNPs in linkage disequilibrium and flanking SNPs with low significance (dark blue dots). (D) PCA plot for cases (blue) and controls (orange). (E) Q-Q plot for association results. (F) Polygenic risk score distribution in cases and controls. PCA, principal component analysis; SNPs, single nucleotide polymorphisms.
Acknowledgments
This image is the copyrighted work of the attributed author or publisher, and
ZFIN has permission only to display this image to its users.
Additional permissions should be obtained from the applicable author or publisher of the image.
Reprinted from Journal of hepatology, 79(6), Glessner, J.T., Ningappa, M.B., Ngo, K.A., Zahid, M., So, J., Higgs, B.W., Sleiman, P.M.A., Narayanan, T., Ranganathan, S., March, M., Prasadan, K., Vaccaro, C., Reyes-Mugica, M., Velazquez, J., Salgado, C.M., Ebrahimkhani, M.R., Schmitt, L., Rajasundaram, D., Paul, M., Pellegrino, R., Gittes, G.K., Li, D., Wang, X., Billings, J., Squires, R., Ashokkumar, C., Sharif, K., Kelly, D., Dhawan, A., Horslen, S., Lo, C.W., Shin, D., Subramaniam, S., Hakonarson, H., Sindhi, R., Biliary atresia is associated with polygenic susceptibility in ciliogenesis and planar polarity effector genes, 1385-1395, Copyright (2023) with permission from Elsevier. Full text @ J. Hepatol.