
- Title
-
Cfdp1 Is Essential for Cardiac Development and Function
- Authors
- Giardoglou, P., Deloukas, P., Dedoussis, G., Beis, D.
- Source
- Full text @ Cells
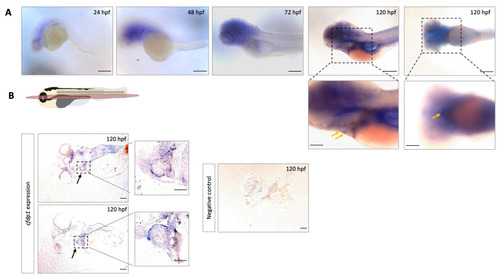
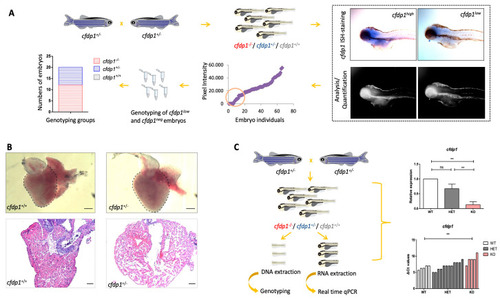
Expression analysis of |
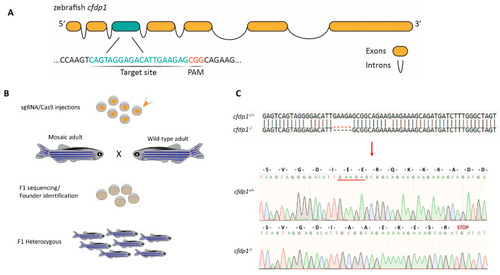
Generation of |
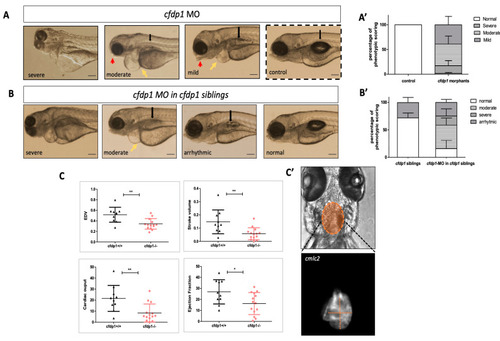
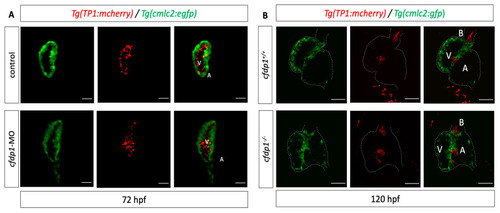
Impaired cardiac performance of |
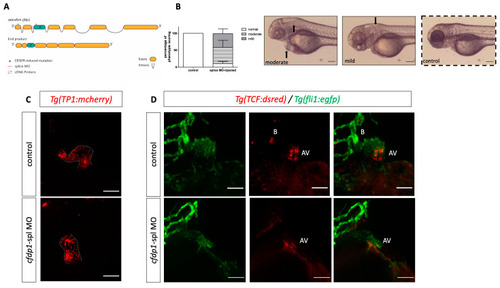
Silencing of EXPRESSION / LABELING:
PHENOTYPE:
|
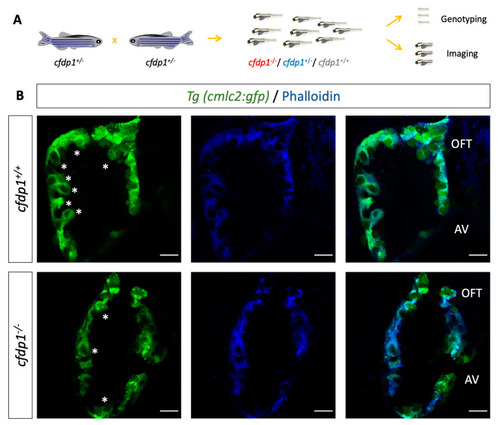
Study of EXPRESSION / LABELING:
PHENOTYPE:
|

PHENOTYPE:
|
PHENOTYPE:
|
PHENOTYPE:
|

Unillustrated author statements |