IMAGE

Figure 3

ID
ZDB-IMAGE-230814-148
Source
Figures for Giardoglou et al., 2023
Image
Figure Caption

Figure 3

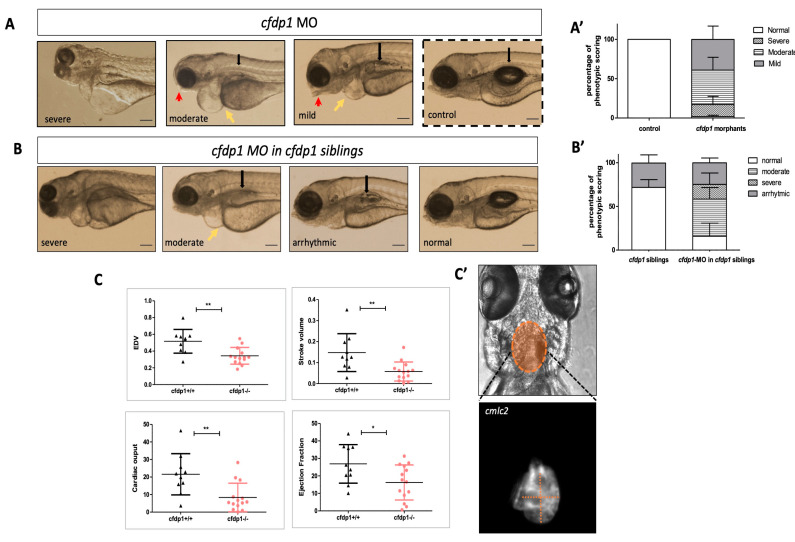
Impaired cardiac performance of cfdp1 mutant embryonic hearts. (A) Stereoscopic images of representative 120 hpf cfdp1-MO-injected (cfdp1 morphants) and uninjected control embryos. Black arrows point to the swim bladder, yellow arrows point to the pericardiac edema, red arrows point to the mouth opening position. Scale bar 150 μm. (A’) Quantification of phenotypic scoring via GraphPad Prism. Data are presented as mean ± SD. n = 40 in each of five independent experiments. (B) cfdp1-MO injections in sibling embryos derived from the cross between heterozygous cfdp1 adult fish. n = 154 in four independent experiments. Black arrows point to the swim bladder, yellow arrows point to the pericardiac edema, red arrows point to the mouth opening position. (B’) Quantification of phenotype scoring of cfdp1 siblings (pool of all three genotypes: cfdp1−/−, cfdp1−/+, cfdp1+/+) and cfdp1-MO-injected cfdp1 sibling embryos. Data are presented as mean ± SD. Scale bar 150 μm. (C) Defective cardiac performance of 120 hpf cfdp1−/− embryos compared to their siblings cfdp1+/+ based on ventricular measurements after recording their heart rates. Data are presented as mean ± SD, n = 10–14/genotype. (C’) Brightfield and fluorescent image of cfdp1 mutant embryos utilizing their Tg(myl7:EGFP) (also referred to as cmlc2) background. Dashed lines indicate the long ventricular axis and the short ventricular axis, respectively.

Acknowledgments
This image is the copyrighted work of the attributed author or publisher, and ZFIN has permission only to display this image to its users. Additional permissions should be obtained from the applicable author or publisher of the image. Full text @ Cells