
- Title
-
The zebrafish mutant dreammist implicates sodium homeostasis in sleep regulation
- Authors
- Barlow, I.L., Mackay, E., Wheater, E., Goel, A., Lim, S., Zimmerman, S., Woods, I., Prober, D.A., Rihel, J.
- Source
- Full text @ Elife
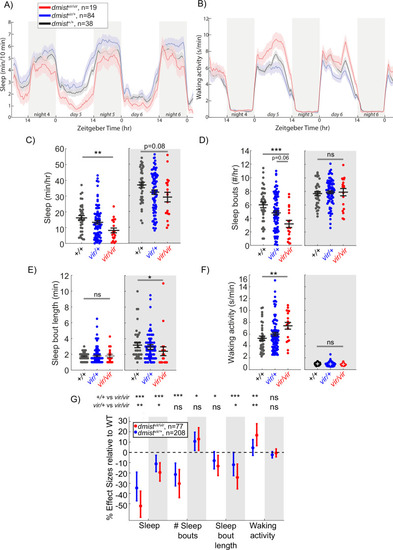
A viral insertion mini-screen identifies a short-sleeping mutant, dreammist. (A, B) Mean ± SEM sleep (A) and waking activity (B) of progeny from dmistvir/+ in-cross from original screen. White blocks show day (lights on) and grey blocks show night (lights off). Data is combined from two independent experiments. n indicates the number of animals. (C–F) Analysis of sleep/wake architecture for the data shown in (A, B). (C) Quantification of total sleep across 2 d and nights shows decreased day and night sleep in dmistvir/vir. Analysis of sleep architecture reveals fewer sleep bouts during the day (D) and shorter sleep bouts at night (E) in dmistvir/vir compared with sibling controls. (F) Daytime waking activity is also increased in dmistvir/vir. The black lines show the mean ± SEM, except in (E), which labels the median ± SEM. *p<0.05, **p<0.01, ***p<0.001; ns p>0.05; one-way ANOVA, Tukey’s post hoc test. (G) Combining five independent experiments using a linear mixed effects model with genotype as a fixed effect and experiment as a random effect reveals dmistvir/vir larvae have decreased total sleep and changes to sleep architecture during both the day and night compared to dmist+/+ siblings. Plotted are the genotype effect sizes (95% confidence interval) for each parameter relative to wild type. Shading indicates day (white) and night (grey). p-Values are assigned by an F-test on the fixed effects coefficients from the linear mixed effects model. *p<0.05, **p<0.01, ***p<0.001, ns p>0.05. n indicates the number of animals. |
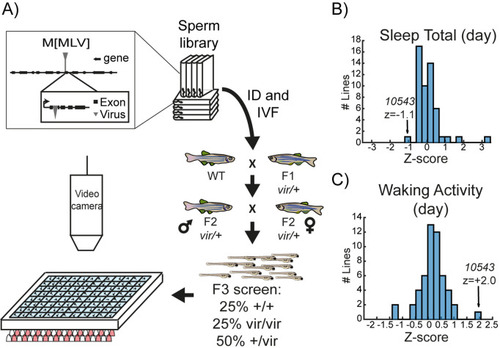
A viral insertion screen for sleep-wake regulators. ( |
( |
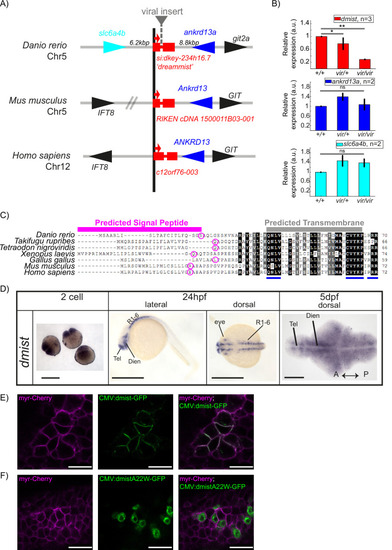
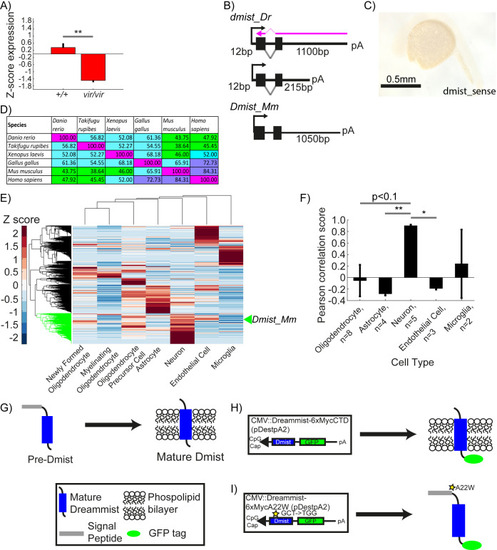
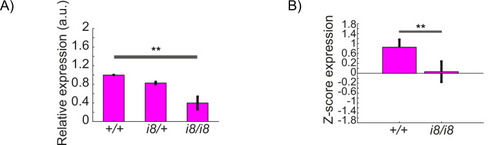
dmist encodes a conserved vertebrate single-pass transmembrane protein. (A) dmist mutants harbour a viral insertion in the first intron of si:key-234h16.7. dmist is syntenic with Ankrd13 and GIT orthologs in mouse, human, and zebrafish. (B) RT-qPCR of dmist (red) show reduced expression of dmist and not the 5′ and 3′ flanking zebrafish genes, slc6a4b (cyan) and ankrd13a (blue), in dmistvir/vir larvae compared to dmistvir/+ and dmist+/+ siblings. **p<0.01, *p<0.05; ns p>0.05; one-way ANOVA, Tukey’s post hoc test. Data shows mean ± SEM normalised to the wild-type mean. (C) dmist_Dr contains an open-reading frame encoding a 70 amino acid protein that is conserved across vertebrates. All identified homologues have a predicted signal peptide sequence (magenta line), signal peptide cleavage site (magenta circle), and predicted transmembrane domain (grey), with additional highly conserved C-terminal motifs (blue lines). Identical amino acids in all species are shown in black; similar amino acids (80–99% conserved across species) are shown in grey. (D) In situ hybridisation using a dmist antisense probe reveals dmist is maternally deposited as it is detected at the two-cell stage. At 24 hpf, expression is restricted to regions containing neuronal precursors, and at 5 dpf expression is widespread throughout the brain. Tel, telencephalon; Dien, diencephalon; R1-6, rhombomeres 1–6; A, anterior; P, posterior. Scale bars = 0.5 mm (two-cell and 24 hpf), 0.1 mm (5 dpf). (E, F) Representative confocal image of 90% epiboly embryo co-injected at the one-cell stage with mRNA encoding membrane-RFP (magenta) and a plasmid encoding either C-terminal tagged Dmist-GFP (E, green) or DmistA22W-GFP (F, green). Scale bar = 25 μm |
( |
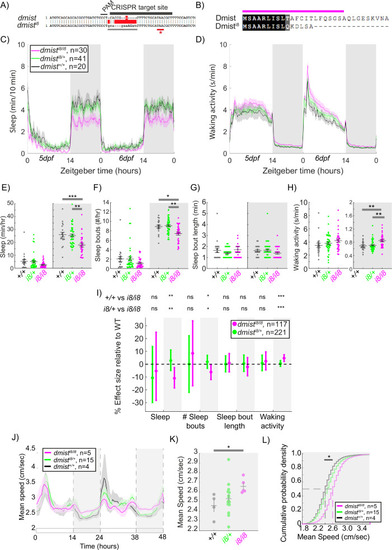
CRISPR-generated dmist mutants sleep less and are hyperactive at night. (A) CRISPR/Cas9 targeting of the first exon of dmist resulted in an 8 bp insertion (dmisti8) (grey line) within the coding sequence, leading to an early stop codon (red line with *). Guide RNA target sequence and PAM sequence are shown as black bars. The sequence that is deleted in the mutant is indicated with a red bar. (B) Predicted Dmisti8 peptide sequence lacks most of the N-terminal signal peptide sequence (magenta) and the full C-terminus. (C, D) Representative 48 hr traces of mean ± SEM sleep (C) and waking activity (D) shows decreased sleep and increased waking activity at night for dmisti8/i8 fish compared to dmisti8/+ and dmist+/+ siblings. n = number of fish. (E–H) Analysis of sleep/wake architecture of the experiment depicted in (C, D) indicates that dmisti8/i8 larvae sleep less at night (E) due to fewer sleep bouts (F). Sleep bout length is unchanged (G). Waking activity is also increased in dmisti8/i8 fish (H). The black line represents the mean ± SEM except for (G), which is the median ± SEM. *p<0.05, **p<0.01, ***p<0.001; one-way ANOVA, Tukey’s post hoc test. (I) Combining five independent experiments with a linear mixed effects model reveals dmisti8/i8 fish sleep less at night due to fewer sleep bouts and also show increased waking activity at night. Plotted are the genotype effect sizes (95% confidence interval) for each parameter relative to wild type. Shading indicates day (white) and night (grey). p-Values are assigned by an F-test on the fixed effects coefficients from the linear mixed effects model. *p<0.05, **p<0.01, ***p<0.001, ns p>0.05. (J) Adult dmisti8/i8 fish have a higher mean swim speed compared to their wild-type siblings at night. Data in (J) is quantified at night in (K). (J, K) show mean ± SEM. *p<0.05, one-way ANOVA. (L) Cumulative probability distribution of all night-time swim bout speeds in adult fish. The dashed lines show the half max (0.5 probability) for each curve. *p<0.05 for dmisti8/i8 fish compared to wild-type siblings; Kolmogorov–Smirnov test. |
CRISPR-generated ( |
Mutation of the ( |
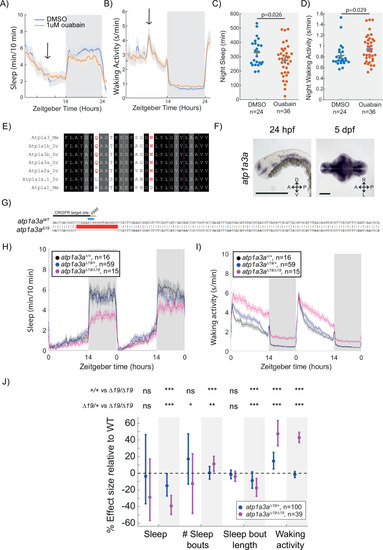
Mutation of the Na+/K+ pump alpha subunit atp1a3a reduces sleep at night. (A, B) Sleep and waking activity traces (± SEM) of wild-type larvae following exposure to 1 µM ouabain. Arrows indicate time the drug was added. (C, D) At night, sleep is significantly reduced and waking activity is significantly increased after ouabain exposure. Student’s t-test, one-tailed. (E) Alignments of Na+/K+ pump alpha subunits around the ouabain binding sites. Red indicates residues that are critical for higher sensitivity to ouabain, both of which are present in mouse Atp1a3 but not Atp1a1. (F) In situ hybridisation of atp1a3a at 24 hpf (whole animal) and 5 dpf brain (ventral view). Anterior is to the left. Scale bar = 0.5 mm (24 hpf); 0.1 mm (5 dpf). A, anterior; P, posterior; D, dorsal; V, ventral (G) CRISPR-Cas9 targeting of the atp1a3a resulted in a 19 bp deletion that eliminates the start codon (blue) and splice junction. Guide RNA target sequence and PAM sequence are shown as black bars. Sequence that is deleted in the mutant is indicated with a red bar. (H, I) Representative behavioural experiment showing atp1a3aΔ19/Δ19 fish are hyperactive throughout the day-night cycle and have decreased sleep at night. Mean ± SEM are shown. (J) atp1a3aΔ19/ Δ19 larvae sleep less at night due to shorter sleep bouts. Plotted are the genotype effect sizes (95% confidence interval) on each parameter relative to wild type. Shading indicates day (white) and night (grey). p-Values are assigned by an F-test on the fixed effects coefficients from the linear mixed effects model. *p<0.05, **p<0.01, ***p<0.001, ns p>0.05. |
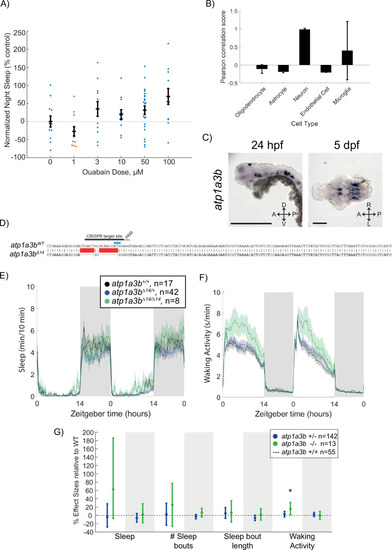
Ouabain dose curve and effects of ( |
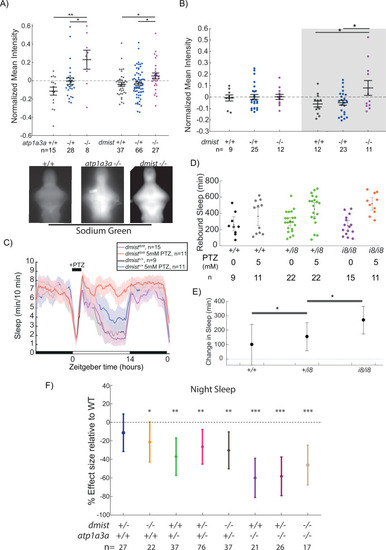
dmist mutants have altered sodium homeostasis. (A) Brain sodium levels are significantly elevated after exposure to pentylenetetrazol (PTZ) in both atp1a3aΔ19/Δ19 (two independent experiments) and dmisti8/i8 (four independent experiments) fish relative to wild type and heterozygous mutant siblings, as measured by fluorescence intensity of Sodium Green, normalised to the sample mean intensity. Crosses show mean ± SEM. n indicates the number of animals. Below are example images of brains stained with Sodium Green. *p<0.05, **p<0.01, one-way ANOVA, Tukey’s post hoc test. (B) Under baseline conditions, brain sodium levels are significantly elevated in dmisti8/i8 fish at night but not during the day, as measured by fluorescence intensity with Sodium Green. Crosses show mean ± SEM. *p<0.05, **p<0.01, one-way ANOVA, Tukey’s post hoc test. (C) dmisti8/i8 larvae have increased rebound sleep compared to wild-type siblings following exposure to 5 mM PTZ. Representative sleep traces of dmist+/+ (no drug, water vehicle controls in black; PTZ exposed in blue) and dmisti8/i8 (no drug in purple; PTZ exposed in red) following 1 hr exposure to 5 mM PTZ (black bar) in the morning. Data are mean ± SEM. dmisti8/+ animals are not plotted for clarity but are included in panel (D). (D) Rebound sleep after exposure to 5 mM PTZ, calculated from the experiment in (C). Each dot represents a single fish, grey lines show mean ± SEM. (E) Effect size of change in sleep after 1 hr treatment with 5 mM PTZ (and washout) compared to vehicle-treated controls (error bars show 95% confidence intervals). *p<0.05, one-way ANOVA, Tukey’s post hoc test. (F) Effect sizes (and 95% confidence interval) relative to wild types (dotted line) on sleep at night in larvae from dmist+/-; atp1a3a+/- in-crosses from three independent experiments. p-Values are assigned by an F-test on the fixed effects coefficients from the linear mixed effects model relative to dmist+/+; atp1a3a+/+ animals. For all sleep-wake parameters, see Figure 6—figure supplement 1. *p<0.05, **p<0.01, ***p<0.0001, ns p>0.05.. |
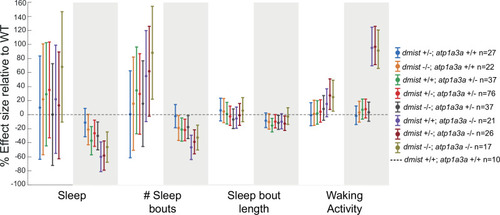
Sleep effects in Combining three independent experiments with a linear mixed effects model reveals that the effects of loss-of-function |