
- Title
-
Loss of Krüppel-like factor 9 deregulates both physiological gene expression and development
- Authors
- Drepanos, L., Gans, I.M., Grendler, J., Guitar, S., Fuqua, J.H., Maki, N.J., Tilden, A.R., Graber, J.H., Coffman, J.A.
- Source
- Full text @ Sci. Rep.
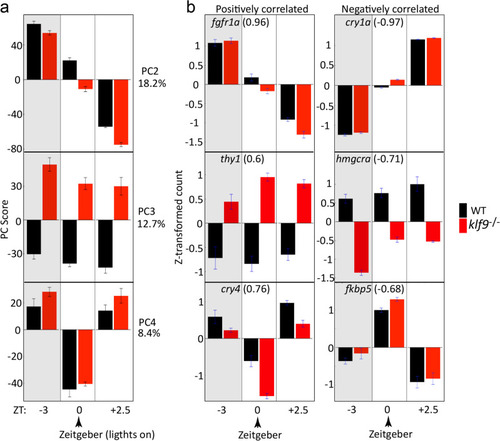
Principal Component Analysis reveals the effects of time of day, genotype, and Zeitgeber on variance between RNA-seq samples. ( |
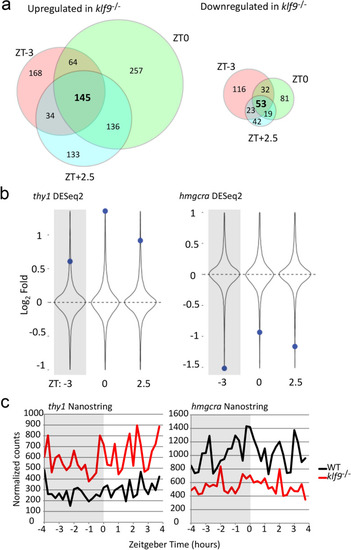
Loss of Klf9 function affects expression of some genes irrespective of time of day. ( |
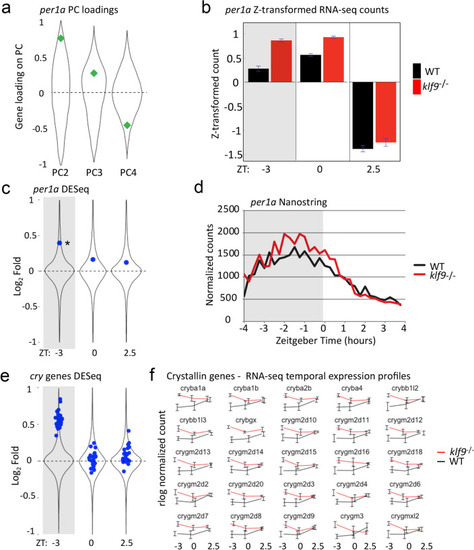
Loss of Klf9 function affects expression of |
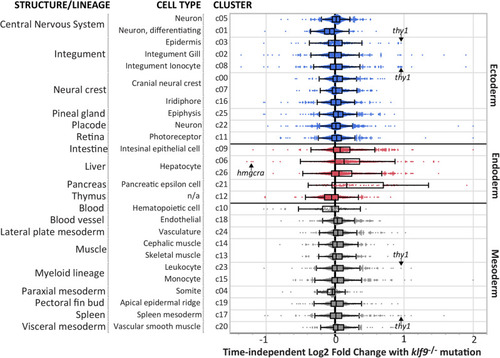
Effect of the |
Klf9 |