
- Title
-
Loss of TDP-43 causes ectopic endothelial sprouting and migration defects through increased fibronectin, vcam 1 and integrin α4/β1
- Authors
- Hipke, K., Pitter, B., Hruscha, A., van Bebber, F., Modic, M., Bansal, V., Lewandowski, S.A., Orozco, D., Edbauer, D., Bonn, S., Haass, C., Pohl, U., Montanez, E., Schmid, B.
- Source
- Full text @ Front Cell Dev Biol
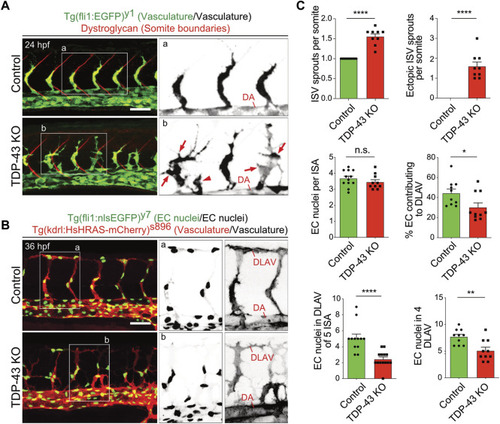
Loss of TDP-43 leads to increased vascular sprouting and defective migration. |
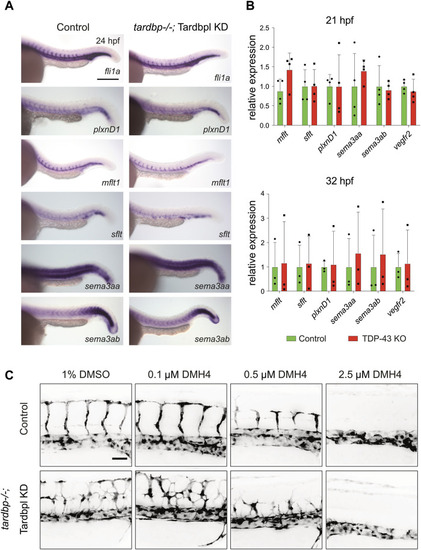
Selected candidate genes and the VEGF pathway are not affected in TDP-43 KO zebrafish |

The |
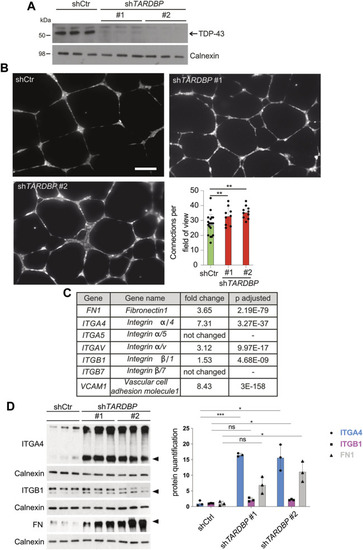
Increased |

|

Mild KD of |