FIGURE

FIGURE 4

ID
ZDB-FIG-230630-4
Publication
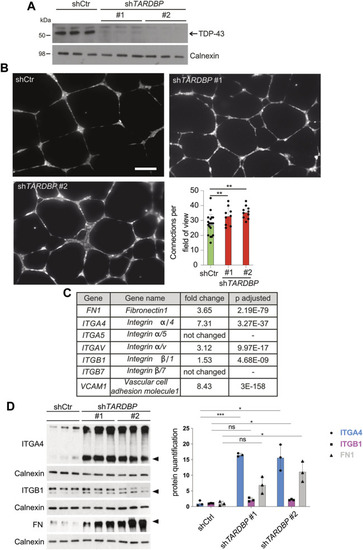
Hipke et al., 2023 - Loss of TDP-43 causes ectopic endothelial sprouting and migration defects through increased fibronectin, vcam 1 and integrin α4/β1
Other Figures
All Figure Page
Back to All Figure Page
FIGURE 4

Increased in vitro angiogenesis upon TDP-43 KD in HUVEC and identification of mis-regulated pathways by NGS. (A) KD of TDP-43 in HUVEC with two different shRNAs, shTARDBP#1 and #2 reduces TDP-43 protein levels. shCtr transduced HUVEC serve as control, each lane represents a biological replicate, Calnexin serves as loading control. (B) Images show tubular network formation of representative fields of view of shCtr, shTARDBP#1, and shTARDBP#2 transduced HUVEC (magnification: ×10). Bar graph displays the quantified connections per field of view in TDP-43 KD with shTARDBP#1 and shTARDBP#2 compared to shCtr. D’Agostino-Pearson omnibus normality test and one-way ANOVA, n ≥ 8 in three independent experiments. (C) Selection of NGS hits of HUVEC upon TDP-43 KD with fold change and adjusted p-value. (D) Immunoblot validation of FN1, ITGA4, and ITGB1 upon KD of TDP-43 with shTARDBP#1 and shTARDBP#2 in comparison to shCtr transduced cells. Each lane represents one biological replicate. The band intensities of the indicated bands (arrowhead) have been quantified using ImageJ, t-test n = 3.

Expression Data

Expression Detail
Antibody Labeling
Phenotype Data

Phenotype Detail
Acknowledgments
This image is the copyrighted work of the attributed author or publisher, and ZFIN has permission only to display this image to its users. Additional permissions should be obtained from the applicable author or publisher of the image. Full text @ Front Cell Dev Biol