
- Title
-
Loss of Nicotinamide nucleotide transhydrogenase sensitizes embryos to ethanol-induced neural crest and neural apoptosis via generation of reactive oxygen species
- Authors
- Mazumdar, R., Eberhart, J.K.
- Source
- Full text @ Front. Neurosci.
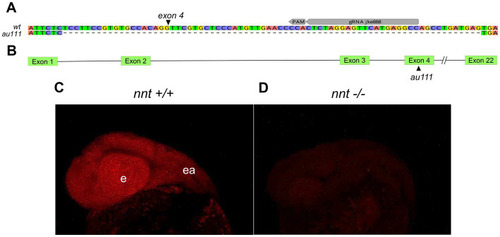
Generation of a zebrafish |
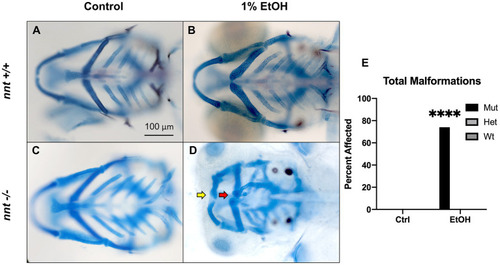
Loss of PHENOTYPE:
|
PHENOTYPE:
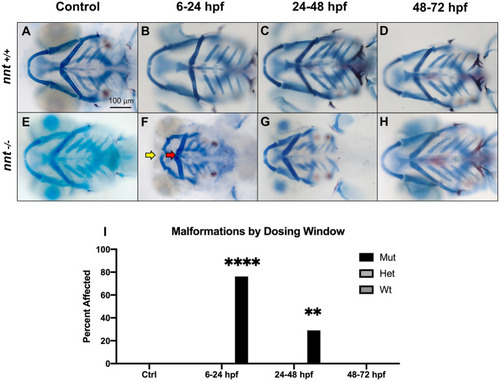
|
Severity of PHENOTYPE:
|
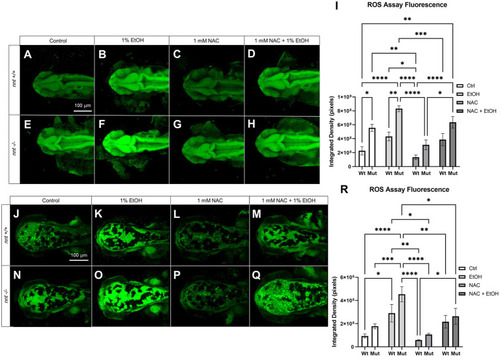
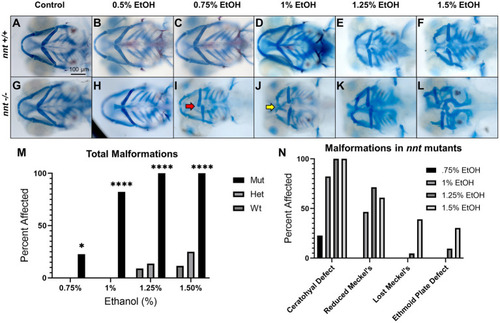
ROS concentration is elevated in |
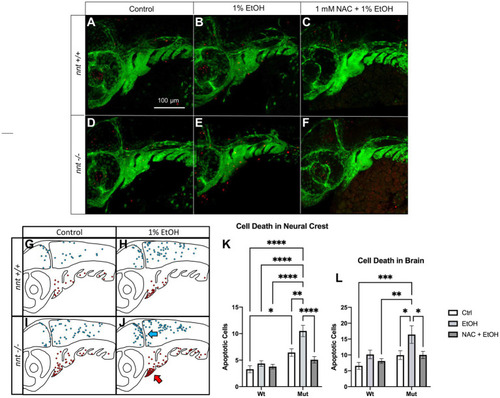
Aberrant ethanol-induced apoptosis in PHENOTYPE:
|
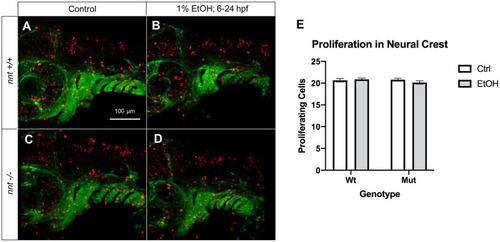
Proliferation is not significantly altered in neural crest of PHENOTYPE:
|
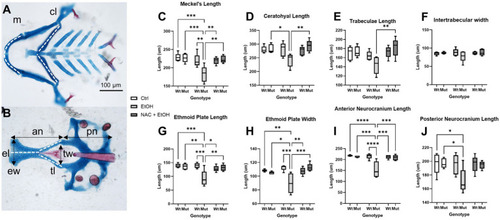
Ethanol-induced craniofacial abnormalities are rescued by concurrent NAC dosage. PHENOTYPE:
|

ZFIN is incorporating published figure images and captions as part of an ongoing project. Figures from some publications have not yet been curated, or are not available for display because of copyright restrictions. PHENOTYPE:
|