IMAGE

Figure 7

ID
ZDB-IMAGE-230629-14
Source
Figures for Mazumdar et al., 2023
Image
Figure Caption

Figure 7

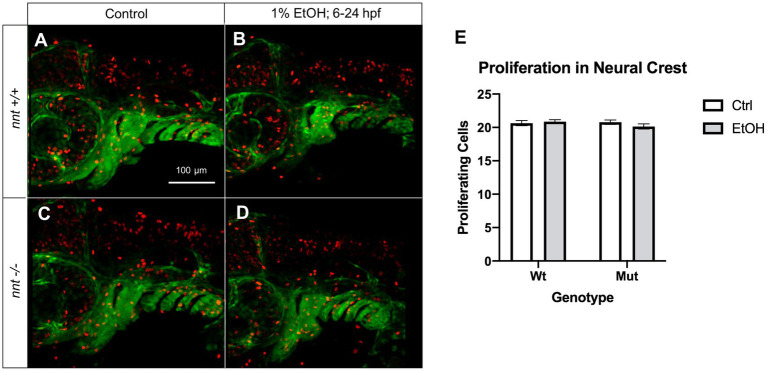
Proliferation is not significantly altered in neural crest of nnt mutants. (A–D) 36 hpf nnt;fli1a:eGFP (green) embryos stained with pHH3 (red). Lateral views, anterior to the left, dorsal up. (A) Unexposed wildtypes and (C) mutants have similar levels of proliferating cells compared to (B) ethanol-treated wildtypes and (D) mutants. (E) Graph depicting proliferating cells in the neural crest (Twoway ANOVA with multiple comparisons, black bars depict mean ± SEM, n = 14 per group). Ctrl: control, EtOH: ethanol, Mut: mutant, Wt: wildtype.

Acknowledgments
This image is the copyrighted work of the attributed author or publisher, and ZFIN has permission only to display this image to its users. Additional permissions should be obtained from the applicable author or publisher of the image. Full text @ Front. Neurosci.