
- Title
-
A protein domain-oriented approach to expand the opportunities of therapeutic exon skipping for USH2A-associated retinitis pigmentosa
- Authors
- Schellens, R.T.W., Broekman, S., Peters, T., Graave, P., Malinar, L., Venselaar, H., Kremer, H., De Vrieze, E., Van Wijk, E.
- Source
- Full text @ Mol Ther Nucleic Acids
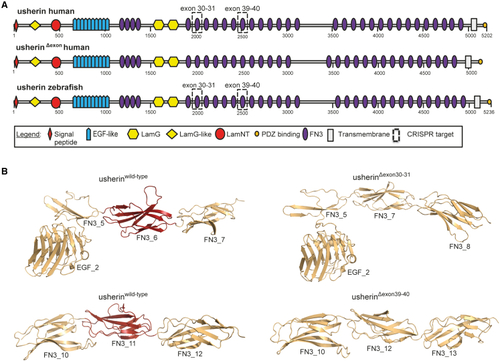
In silico modeling of usherin domain architecture after USH2A exon 30–31 and exon 39–40 skipping (A) Schematic representation of the domain architecture of the large isoform (isoform B) of human and zebrafish usherin. Isoform B of human and zebrafish usherin are composed of the same repetitive domain architecture that includes a signal peptide, a laminin G-like domain (LamG-like), a laminin N-terminal domain (LamNT), 10 EGF-like motifs, four fibronectin type III (FN3) domains, two laminin G domains (LamG), 28 additional FN3 domains, one transmembrane domain, and a short intracellular region with a C-terminal class I PDZ binding motif. Skipping of exons 30–31 and exons 39–40 both result in the absence of one FN3 domain. The domains that are lost in human and zebrafish usherin are indicated with dashed boxes. Both proteins that result from exon skipping are composed of the same protein domain architecture (visualized as usherinΔexon). Numbers indicate amino acids. (B) For both skipping of USH2A exons 30–31 and exons 39–40, 3D homology modeling predicts the removal of exactly one FN3 domain without disturbing the folding of neighboring FN3 domains. The part of usherin that is encoded by the targeted exons is depicted in red. |
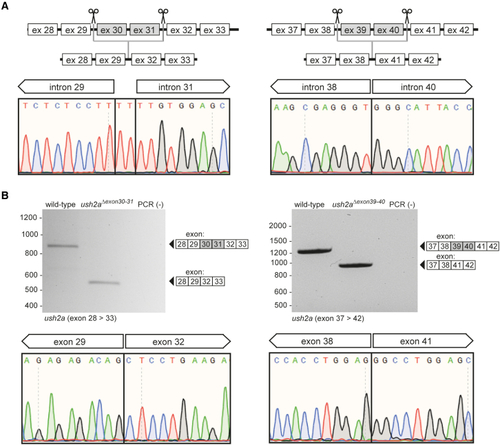
Design and characterization of the ush2aΔexon30-31 and ush2aΔexon39-40 zebrafish line (A) Schematic representation of the exon-excision approach. Sanger sequencing confirmed the presence of the anticipated excisions in injected embryos (1 day post fertilization [dpf]). Excision of the genomic region containing ush2a exons 30 and 31 resulted in the insertion of two nucleotides (TT) at the repair junction. (B) RT-PCR analysis revealed the absence of ush2a exons 30 and 31 in ush2aΔexon30-31 larvae and the absence of exons 39 and 40 in ush2aΔexon39-40 larvae (5 dpf). Sanger sequencing of the ush2aΔexon30-31 and ush2aΔexon39-40 amplicons confirmed the absence of the target exons from the transcript. |
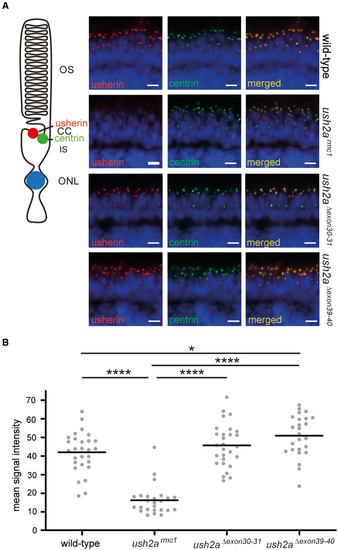
Visualization of usherin on retinal sections of wild-type, ush2armc1, ush2aΔexon30-31, and ush2aΔexon39-40 zebrafish (A) Retinal cryosections of wild-type, ush2armc1, ush2aΔexon30-31, and |
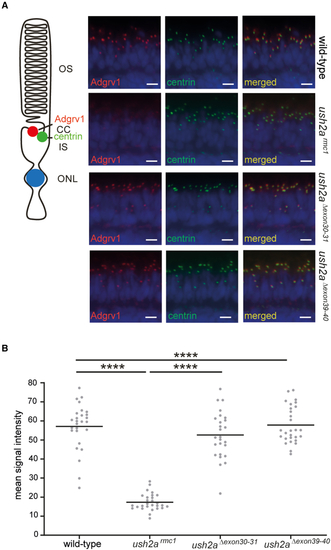
Visualization of Adgrv1 in retinal sections of wild-type, ush2armc1, ush2aΔexon30-31, and ush2aΔexon39-40 zebrafish (A) Retinal cryosections of wild-type, ush2armc1, ush2aΔexon30-31, and ush2aΔexon39-40 larvae (5 dpf) stained with antibodies directed against Adgrv1 (red) and centrin (green). Nuclei are counterstained with DAPI (blue). A reduced Adgrv1 signal was detected in ush2armc1 zebrafish retinas, whereas in the retinas of wild-type, ush2aΔexon30-31, and ush2aΔexon39-40 larvae, usherin was present adjacent to the centrin immunoreactivity. Scale bar, 10 μm. CC, connecting cilium; IS, inner segment; ONL, outer nuclear layer; OS: outer segment. (B) Quantification of anti-Adgrv1 signal intensity at the periciliary region. Individual data points represent the mean fluorescence intensity of anti-Adgrv1 staining at the periciliary region of all photoreceptors of a single, central section of one larval zebrafish eye. Horizonal bars depict the mean signal intensity within a genotype (n = 26–28 eyes). Data were analyzed using one-way ANOVA followed by Tukey’s multiple comparison test. ∗∗∗∗p ≤ 0.0001. |
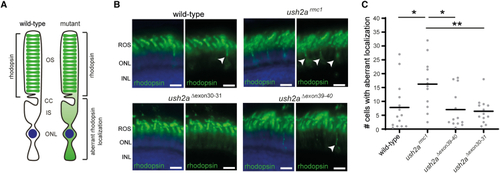
Visualization of rhodopsin in retinal sections of wild-type, ush2armc1, ush2aΔexon30-31, and ush2aΔexon39-40 zebrafish (A) In the photoreceptors of wild-type zebrafish, rhodopsin predominantly localizes to the outer segments, whereas in photoreceptors of mutant zebrafish, rhodopsin is defectively localized. (B) Retinal cryosections of larvae (6 dpf) were analyzed for rhodopsin (green) localization. Nuclei were counterstained with DAPI (blue). In the retinas of wild-type, ush2aΔexon30-31, and ush2aΔexon39-40 larvae, rhodopsin was predominantly present in the photoreceptor outer segments, whereas in ush2armc1 retinas rhodopsin signal was also detected in the photoreceptor cell bodies as indicated by arrowheads. Scale bar, 10 μm. INL, inner nuclear layer; ONL, outer nuclear layer; ROS, rod outer segment. (C) Scatterplot of detected photoreceptor cells with aberrant rhodopsin localization in 6 dpf zebrafish obtained by manual counting and plotted per counted eye (n = 12–14). Horizonal bars depict the mean number of photoreceptor cells with aberrant rhodopsin localization within a genotype. The number of cells with aberrant rhodopsin localization is significantly lower in wild-type, ush2aΔexon30-31, and ush2a |

ASOs induce a dose-dependent skipping of USH2A target exons HEK293T cells are co-transfected with the exons 30–31 minigene splice vector and different concentrations of ASOs targeting (A) exon 30 and (B) exon 31 or with the exons 39–40 minigene splice vector and different concentrations of ASOs targeting (C) exon 39, (D) exon 40, or (E) exons 39 and 40. Each transfection resulted in a concentration-dependent increase in transcripts without the targeted exon(s). Amplicons with and without the targeted exon(s) are indicated adjacent to the gel image. For simultaneous transfection of multiple ASOs, the total ASO concentration is shown. GAPDH amplification is shown as a loading control. ASO, antisense oligonucleotide; mmASO, mismatch ASO; PCR(−), negative PCR control. |
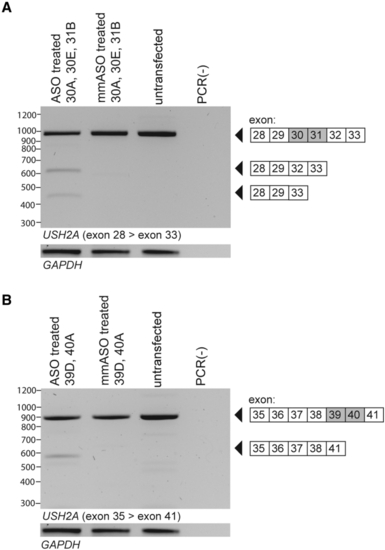
Validation of ASO-induced dual exon skipping for USH2A exons 30–31 and USH2A exons 39–40 in WERI-Rb-1 cells Co-transfection of WERI-Rb-1 cells with ASOs targeting either (A) exons 30 and 31 or (B) exons 39 and 40, resulted in the combined skipping of the exons of interest. Co-transfection of WERI-Rb-1 cells with ASOs targeting exons 30 and 31 also resulted in additional skipping of exon 32. In WERI-Rb-1 cells treated with ASOs targeting exons 39 and 40, no detectable amounts of alternatively spliced transcripts different from untransfected samples were present. GAPDH amplification is shown as a loading control. ASO, antisense oligonucleotide; mmASO, mismatch ASO; PCR(−), negative PCR control. |