FIGURE SUMMARY
Title

Social and asocial learning in zebrafish are encoded by a shared brain network that is differentially modulated by local activation

Authors
Pinho, J.S., Cunliffe, V., Kareklas, K., Petri, G., Oliveira, R.F.
Source
Full text @ Commun Biol

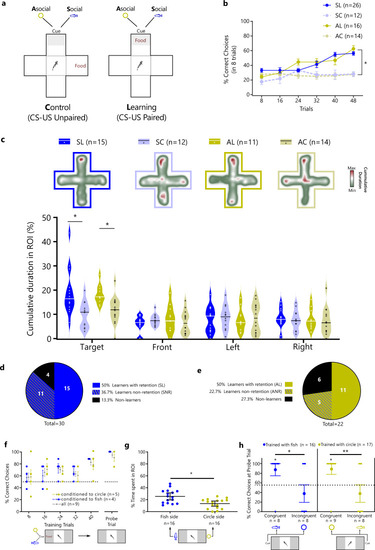
Social and asocial classic conditioning in zebrafish.

a Schematic representation of the plus-maze paradigm: 4 groups observed a CS (social or asocial cue) paired with a US (food: bloodworms) in the same arm (paired treatments: SL and AL) hence being able to establish the CS-US association; or in different arms (unpaired treatments: SC and AC) the controls of the experiment. b During the training phase animals increased significantly the percentage of correct choices both in the social learning (SL, in red circles) and asocial learning (AL, in light red circles) treatments in comparison with the respective unpaired treatments [in blue circles social unpaired control (SC) and in light blue circles the asocial unpaired control (AC)]. c In the probe test, the cumulative duration of time spent in the RoI (heats maps provide illustrative examples of space use by representative individuals from each treatment) indicates that learners (social and asocial) increased the time spent in the target arm (line inside each violin plot indicates the median). Pie graphs indicate the proportion of learners, non-learners and non-retention animals in: d social; and e asocial conditions. f The ability of the animals to distinguish between the social and asocial stimuli used in this experiment was tested by conditioning the animals to approach one stimulus and avoid other, independent of their initial preference (in yellow triangles animals conditioned to approach asocial, in light pink squares individuals conditioned to approach social and in black circles the average of all individuals). g The preference for the social and asocial stimuli [fish (yellow circle) or circle (gray square) static 2D picture, respectively was assessed using a preference test. h To test social and non-social cue specificity in associative learning, animals exhibiting learning in a two-choice paradigm with local food-reward paired either with the circle or the fish shape (p > 50% for rewarded location) were tested at probe trials with either the cue they were trained (congruent) or the other cue (incongruent), where the significant preference for the congruent cue significantly contrasted the lack of preference for the incongruent cue [*P ≤ 0.05, ** P ≤ 0.01]. Asterisks indicate statistical significance at p < 0.05 using planned comparisons. Error bars report the standard error of the mean in the graphs of panels b, f, g, and h.

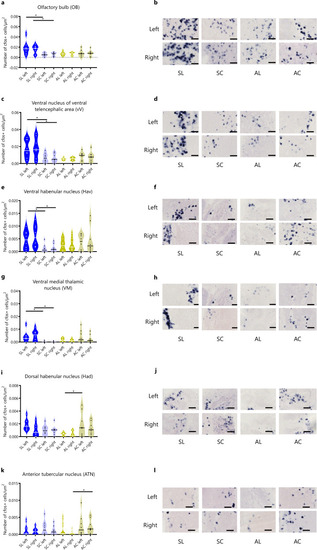
Neuronal activity associated with social (a–h) and asocial (i–l) classic conditioning in zebrafish assessed by in situ hybridization of the immediate early gene c-fos.

Representative photomicrographs of c-fos in situ hybridization in areas that present significant differences associated with learning: OB b, Vv d, Hav f, VM h, Had j, and ATN l. Asterisks indicate statistical significance at p < 0.05 using planned comparisons followed by Benjamini and Hochberg’s method for multiple comparisons p-value adjustment. The line within each violin plot indicates the median. Scale bars represent 40 µm. See Table 1 for abbreviations of brain regions.

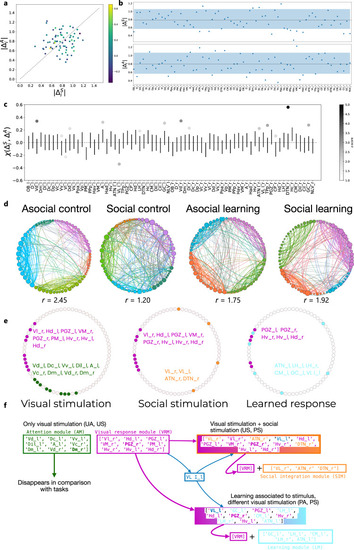
Brain networks associated with social and asocial learning.

a Similarity of region neighborhoods between social |ΔSi| and asocial learning |ΔAi|, where the color of each data point identifies XSi, ΔAi). bSi| and |ΔAi| for all brain regions; the blue color band identifies the interval between the 5th and 95th percentiles of the randomized distribution; For details on the statistical significance see Supplementary Tables 1 and 2. c Similarity XSi, ΔAi) values for all brain regions. Error bars represent one standard deviation over and below the null mean value; regions marked with dots are those with ξ values significantly different from random; the gray scale encodes the z-score of the region’s = ξ value with respect to the random null model; For details on the statistical significance see Supplementary Table 3. d Detection of robust modules (aka communities) in the brain networks for each treatment; within each treatment, network nodes were ordered and colored according to the community they belong to, and the degree of integration (lower r) or segregation (higher r) of the networks is provided; in all cases the measured r values are significantly larger than expected (for statistical details see Supplementary Fig. 3 and Supplementary Table 4), and there are differences in integration across treatments (for statistical details see Supplementary Fig. 4 and Supplementary Table 5). e Conserved brain network submodules between treatments reveal a default mode network (green module), a visual response module (purple module) a social integration module (orange module) and a learning module (blue module); regions indicated in bold font are those highlighted by the analysis based on their egonetworks. f Schematic representation of how the identified modules are recruited to the different tasks: the common modules present in the non-learning (i.e. unpaired US-CS) treatments (i.e. UA, US) are interpreted as a default mode network (green module; this module “Disappears in comparison with the tasks” meaning that it is only present in the two control treatments and does not show up when fish are engaged in one of the behavioral tasks) and a network responding to visual stimulation (purple module), given that the latter is also present across all four conditions; the common modules between unpaired and paired US-CS (i.e. US, PS) treatments are interpreted as a social module (blue module), since the commonality between these two treatments is the presence of a social stimulus; the common module between the two learning treatments (i.e. PA, PS) is interpreted as a learning module (blue module), since the commonality between these two treatments is the US-CS pairing during the training trials.

Acknowledgments
This image is the copyrighted work of the attributed author or publisher, and ZFIN has permission only to display this image to its users. Additional permissions should be obtained from the applicable author or publisher of the image. Full text @ Commun Biol