IMAGE

Fig. 1

ID
ZDB-IMAGE-230617-44
Source
Figures for Pinho et al., 2023
Image
Figure Caption

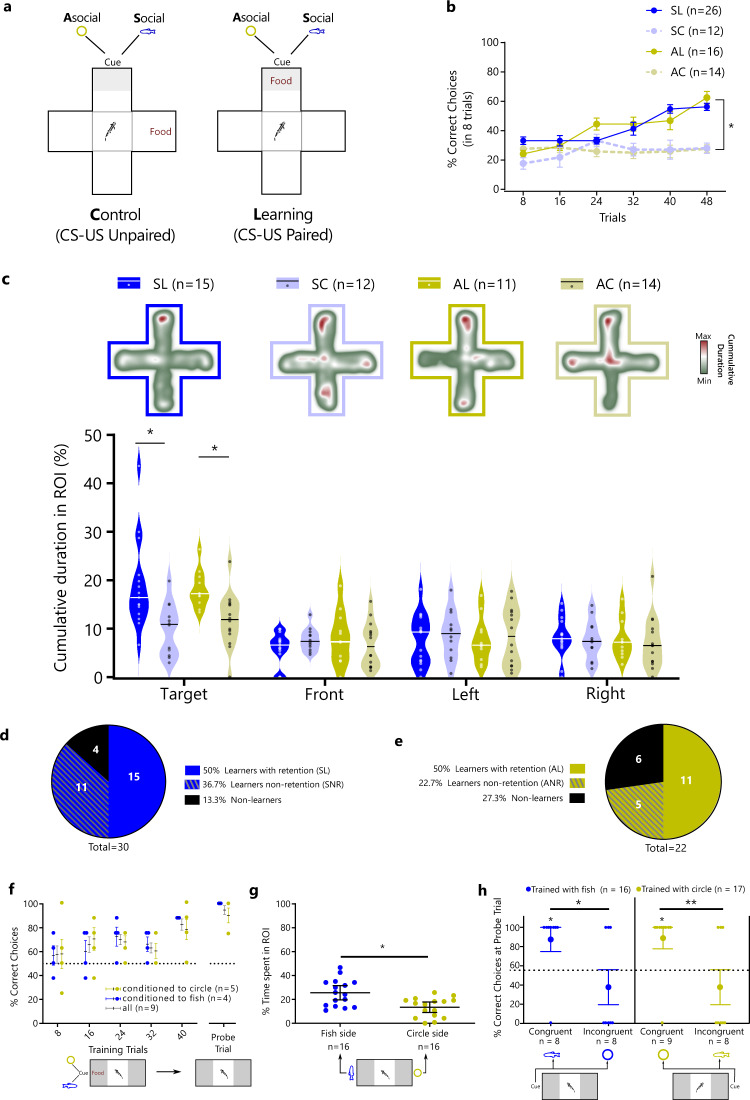
Fig. 1 Social and asocial classic conditioning in zebrafish.

a Schematic representation of the plus-maze paradigm: 4 groups observed a CS (social or asocial cue) paired with a US (food: bloodworms) in the same arm (paired treatments: SL and AL) hence being able to establish the CS-US association; or in different arms (unpaired treatments: SC and AC) the controls of the experiment. b During the training phase animals increased significantly the percentage of correct choices both in the social learning (SL, in red circles) and asocial learning (AL, in light red circles) treatments in comparison with the respective unpaired treatments [in blue circles social unpaired control (SC) and in light blue circles the asocial unpaired control (AC)]. c In the probe test, the cumulative duration of time spent in the RoI (heats maps provide illustrative examples of space use by representative individuals from each treatment) indicates that learners (social and asocial) increased the time spent in the target arm (line inside each violin plot indicates the median). Pie graphs indicate the proportion of learners, non-learners and non-retention animals in: d social; and e asocial conditions. f The ability of the animals to distinguish between the social and asocial stimuli used in this experiment was tested by conditioning the animals to approach one stimulus and avoid other, independent of their initial preference (in yellow triangles animals conditioned to approach asocial, in light pink squares individuals conditioned to approach social and in black circles the average of all individuals). g The preference for the social and asocial stimuli [fish (yellow circle) or circle (gray square) static 2D picture, respectively was assessed using a preference test. h To test social and non-social cue specificity in associative learning, animals exhibiting learning in a two-choice paradigm with local food-reward paired either with the circle or the fish shape (p > 50% for rewarded location) were tested at probe trials with either the cue they were trained (congruent) or the other cue (incongruent), where the significant preference for the congruent cue significantly contrasted the lack of preference for the incongruent cue [*P ≤ 0.05, ** P ≤ 0.01]. Asterisks indicate statistical significance at p < 0.05 using planned comparisons. Error bars report the standard error of the mean in the graphs of panels b, f, g, and h.

Acknowledgments
This image is the copyrighted work of the attributed author or publisher, and ZFIN has permission only to display this image to its users. Additional permissions should be obtained from the applicable author or publisher of the image. Full text @ Commun Biol