|
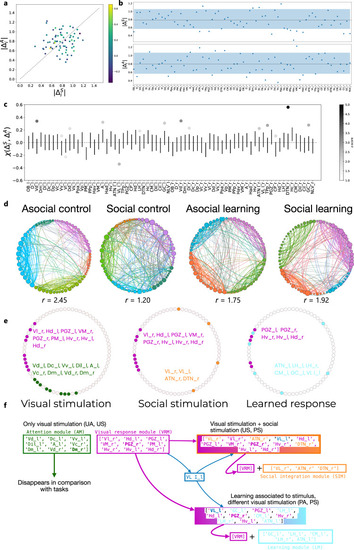
Brain networks associated with social and asocial learning. a Similarity of region neighborhoods between social |ΔSi| and asocial learning |ΔAi|, where the color of each data point identifies X(ΔSi, ΔAi). b |ΔSi| and |ΔAi| for all brain regions; the blue color band identifies the interval between the 5th and 95th percentiles of the randomized distribution; For details on the statistical significance see Supplementary Tables 1 and 2. c Similarity X(ΔSi, ΔAi) values for all brain regions. Error bars represent one standard deviation over and below the null mean value; regions marked with dots are those with ξ values significantly different from random; the gray scale encodes the z-score of the region’s = ξ value with respect to the random null model; For details on the statistical significance see Supplementary Table 3. d Detection of robust modules (aka communities) in the brain networks for each treatment; within each treatment, network nodes were ordered and colored according to the community they belong to, and the degree of integration (lower r) or segregation (higher r) of the networks is provided; in all cases the measured r values are significantly larger than expected (for statistical details see Supplementary Fig. 3 and Supplementary Table 4), and there are differences in integration across treatments (for statistical details see Supplementary Fig. 4 and Supplementary Table 5). e Conserved brain network submodules between treatments reveal a default mode network (green module), a visual response module (purple module) a social integration module (orange module) and a learning module (blue module); regions indicated in bold font are those highlighted by the analysis based on their egonetworks. f Schematic representation of how the identified modules are recruited to the different tasks: the common modules present in the non-learning (i.e. unpaired US-CS) treatments (i.e. UA, US) are interpreted as a default mode network (green module; this module “Disappears in comparison with the tasks” meaning that it is only present in the two control treatments and does not show up when fish are engaged in one of the behavioral tasks) and a network responding to visual stimulation (purple module), given that the latter is also present across all four conditions; the common modules between unpaired and paired US-CS (i.e. US, PS) treatments are interpreted as a social module (blue module), since the commonality between these two treatments is the presence of a social stimulus; the common module between the two learning treatments (i.e. PA, PS) is interpreted as a learning module (blue module), since the commonality between these two treatments is the US-CS pairing during the training trials.
|