
- Title
-
The direct and gut microbiota-mediated effects of dietary bile acids on the improvement of gut barriers in largemouth bass (Micropterus salmoides)
- Authors
- Xia, R., Zhang, Q., Xia, D., Hao, Q., Ding, Q., Ran, C., Yang, Y., Cao, A., Zhang, Z., Zhou, Z.
- Source
- Full text @ Anim Nutr
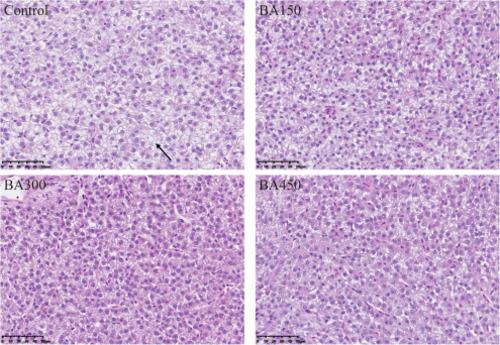
Histology of liver in largemouth bass fed on one of the experimental diets for 5 weeks (scale bar = 50 μm). Black arrows indicate the presence of liver cell swelling and vacuolar degeneration. |
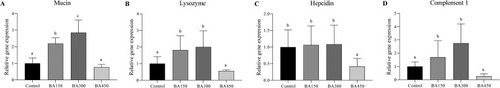
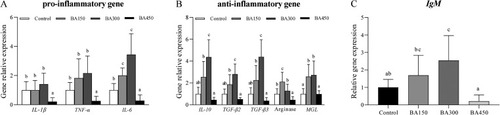
The expression of genes related to gut secretions in the intestine of largemouth bass fed with one of the experimental diets for 5 weeks. Results are presented as the means (±SEM) (n = 6). Bars with different letters are significantly different (Duncan's test; P < 0.05). |
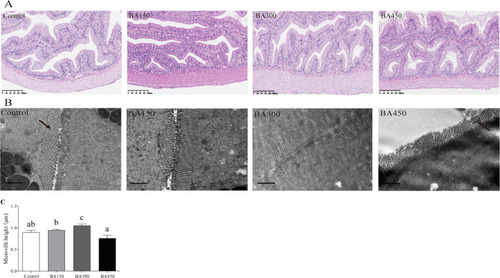
Effects of bile acids on the intestine of largemouth bass fed with one of the experimental diets for 5 weeks. (A) Hematoxylin and eosin (H&E) staining for histology examination (scale bar = 100 μm). (B) Transmission electron microscopy (TEM) micrographs (Black arrow: imperfect microvilli texture or the microvilli of the intestine were peeled) (scale bar = 1 μm). (C) Microvilli height of largemouth bass. Results are presented as the means (±SEM) (n = 6). Bars with different letters are significantly different (Duncan's test; P < 0.05). |
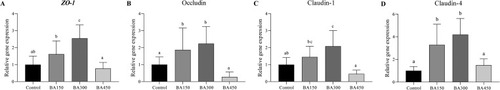
Effects of the gene levels of tight junction genes in the intestine of largemouth bass fed with one of the experimental diets for 5 weeks. Results are given as the means (±SEM) (n = 6). Bars with different letters are significantly different (Duncan's test; P < 0.05). |
Gut expression levels of inflammation-related genes in largemouth bass fed with one of the experimental diets for 5 weeks. Results are given as the means (±SEM) (n = 6). Bars with different letters are significantly different (Duncan's test; P < 0.05). |
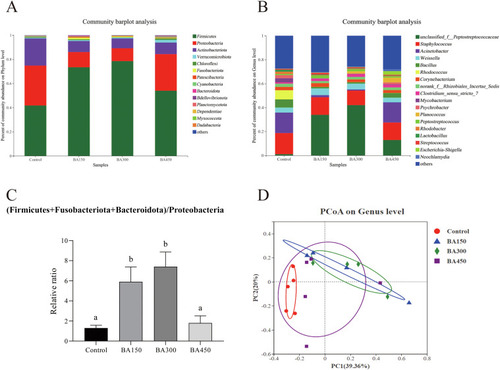
Effects of supplementation of BAs on gut microbiota of largemouth bass, at (A) phylum level, (B) genus level, (C) relative ratio of (Firmicutes + Fusobacteria + Bacteroidetes) to Proteobacteria and (D) principal coordinate analysis (PCoA) analysis, fed with 4 different diets for 5 weeks (n = 4 in BA150 and BA300 groups, n = 5 in Control and BA450 groups). Bars with different letters are significantly different (Duncan's test; P < 0.05). |
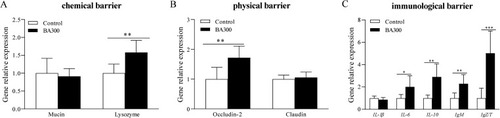
Effect of direct feeding of bile acids on the gut barriers: (A) chemical barrier, (B) physical barrier, (C) immunological barrier, in germ-free zebrafish. Results are given as the means (±SEM) (n = 6). Values marked with asterisks are significantly different (∗P < 0.05, ∗∗P < 0.01 and ∗∗∗P < 0.001). |
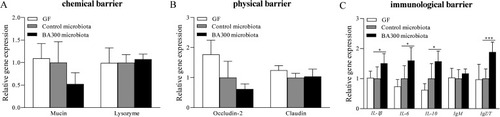
The expression of genes related to gut barriers: (A) chemical barrier, (B) physical barrier, (C) immunological barrier, in germ-free zebrafish colonized with gut microbiota from the control or from the BA300 group. Results are given as the means (±SEM) (n = 6). Values marked with asterisks are significantly different (∗P < 0.05, and ∗∗∗P < 0.001). |