
Image
|
Figure Caption
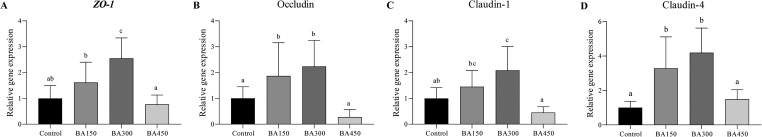
Fig. 4 Effects of the gene levels of tight junction genes in the intestine of largemouth bass fed with one of the experimental diets for 5 weeks. Results are given as the means (±SEM) (n = 6). Bars with different letters are significantly different (Duncan's test; P < 0.05).
Acknowledgments
This image is the copyrighted work of the attributed author or publisher, and
ZFIN has permission only to display this image to its users.
Additional permissions should be obtained from the applicable author or publisher of the image.
Full text @ Anim Nutr