
- Title
-
Deficiency of AP1 Complex Ap1g1 in Zebrafish Model Led to Perturbation of Neurodevelopment, Female and Male Fertility; New Insight to Understand Adaptinopathies
- Authors
- Mignani, L., Facchinello, N., Varinelli, M., Massardi, E., Tiso, N., Ravelli, C., Mitola, S., Schu, P., Monti, E., Finazzi, D., Borsani, G., Zizioli, D.
- Source
- Full text @ Int. J. Mol. Sci.
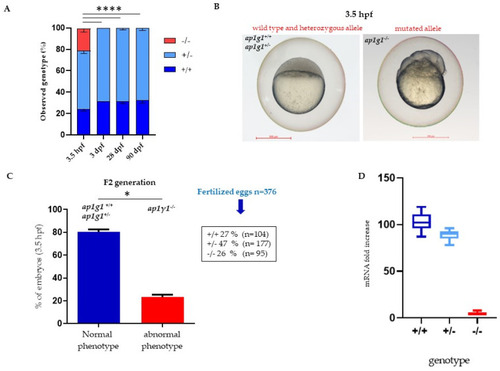
Characterization of ap1g1 mutant embryos and larvae. (A) Representative images of genotype distribution at different developmental stages. Data derived from five different matings with n = 100 in each mating. For genotyping see Math and Met Section. (B) Comparison of the morphological phenotype of embryos derived from F2 generation (F1 ap1g1+/− × F1 ap1g1+/−) at 3.5 hpf. (C) In the graph blue bar indicates the percentage (%) of embryos with +/+ and +/− genotype and normal phenotype, the red bar indicates the embryos with −/− genotype and abnormal phenotype. The data represent one experiment out of three with n = 376 embryos. (* p < 0.05, **** p < 0.0001 One-way ANOVA + Newman-Keuls). Size bar = 500 μm; (D) qPCR analysis of ap1g1 transcript from ap1g1+/+; ap1g1+/− and ap1g1−/− embryos at 24 hpf. Gene expression was normalized using rpl13a as a reference gene and expressed as the mRNA fold increased. EXPRESSION / LABELING:
PHENOTYPE:
|
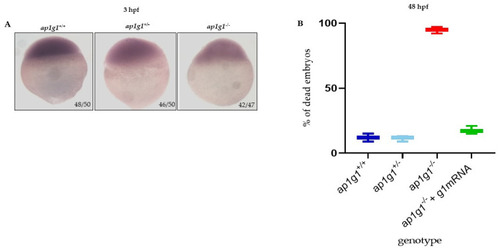
Characterization of ap1g1 mutant embryos. (A) Whole mount in situ hybridization (WISH) for dspb performed in embryos at 3.5 hpf. The experiment was done three times with n = 25 embryos at each experiment. Ratios at the bottom-right part of each picture specify the number of embryos showing the same staining pattern, compared to the total number of embryos used for each experiment. The images were taken in dorsal position at 32× magnification with a Zeiss Axiozoom V13 (Zeiss, Jena, Germany) microscope, equipped with a PlanNeoFluar Z1×/0.25 FWD 56 mm lens and Zen Pro software. (B) The graph in the panel shows, at 48 hpf, the percentage of dead embryos of the three different genotypes and the percentage of dead embryos after the microinjection with zebrafish wild type γ1 mRNA. The experiment was repeated three times. |
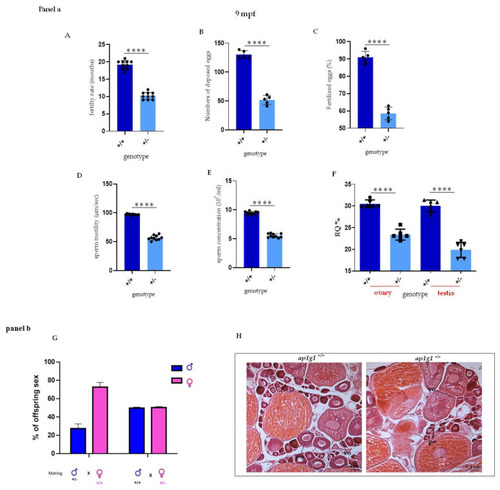
Fertility analysis in heterozygous ap1g1+/− fish. Panel a (A) The graph represents the fertility rate of heterozygous compared to +/+ females. The data are representative of five different experiments with 10 fish per group (B,C) The graphs show respectively the number of laid eggs and fertilized eggs in +/+ and +/− females at 9-mouths-old fish obtained by three different experiments; the observed female was 12 for each group. Concentration (D), velocity (E) and viability (F) of ejaculated sperm. Depicted is mean ± SEM. **** p < 0.0001; n = 10, in triplicate. Motility (D) and concentration (E) of ejaculated sperm from 1-year-old fish. Experiment was done twice. Motility: n = 10 +/+ mean = 97.20 and n = 10 +/− mean = 56.80; concentration: n = 7 +/+ mean = 9.46 × 10⁷/mL and n = 7 +/− mean = 5.54 × 10⁷/mL. (F) qPCR analysis on +/+ and +/− fish respectively in ovary and testis. The experiment was repeated twice. n = 10 for each column. Panel b (G) The graph represents the percentage of different offspring obtained by matings between ap1g1+/− male and ap1g1+/+ female and ap1g1+/+ male with ap1g1+/− female. (H) Histological analysis of ap1g1+/+ and ap1g1+/− ovary detects oocyte maturation defects in mutant females; black arrowheads indicate debris of atretic follicles. Abbreviations: po primary oocyte, vo vitellogenic oocyte. |
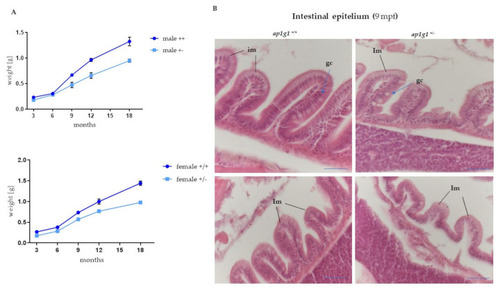
Histological analysis of intestinal epithelium in adult fish. (A) Growth curve of ap1g1+/+ and ap1g1+/−. Body weight (in gr) was measured at different ages of adult life from 3 to 18 months. Both males’ and females’ ap1g1+/− body weight is significantly lower compared to ap1g1+/+. Statistical significance was determined by multiple t-test comparing each age group. For each group, 10 individuals were used and data was derived from two different experimental groups. (B) Histological analysis of ap1g1+/+ and ap1g1+/− intestinal mucosa with abnormal epithelium at the villous tips and reduced height of villi in the heterozygous mutant at 9 months age-old compared to wild-type homozygous fish. Scale bar = 100 μm Abbreviations: im: intestinal mucosa; gc: globet cells. PHENOTYPE:
|
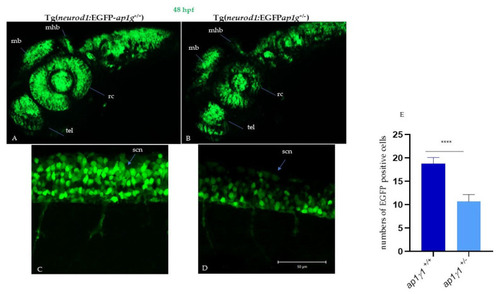
Neuronal characterization of ap1g1+/+ and ap1g1+/− embryos: Confocal images of ap1g1+/+ and ap1g1+/− embryos in transgenic background tg(neurod1:EGFP) 48 hpf. Lateral view of the central nervous system (A) and of spinal cord neurons (B) acquired using an LSM510 Meta confocal microscope (Zeiss (Oberkochen, Germany). (A,B) Images were acquired using a Plan-Neofluar 10X/0.3NA objective. A Z-stack was performed to acquire the whole central nervous system and Maximum Intensity Projection was obtained using Zen Black software. Abbreviations: mb, midbrain; hb, hindbrain; mhb, midbrain–hindbrain boundary; tel, telencephalon; rc, retinal cells; snc, spinal cord neurons. Single plane images were acquired using a PlanApochromat-63X/1.4 NA oil DIC objective. Size bar: 50 µm. (C,D) EGFP-positive cells were quantified by drawing polygonal regions on the image acquired and manually counting the number of cell somas in the selected area. The analysis is the result of 3 different experiments with n = 15 for each genotype. (E) Quantification of EGFP positive cells in the described spinal cord area described in figure C and D; **** p < 0.0001, Student’s t-test. |
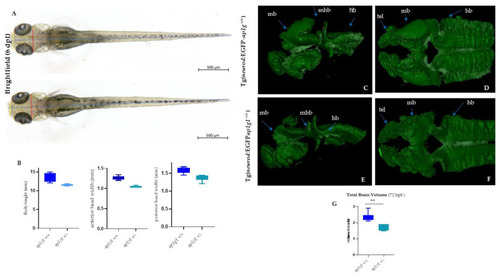
Analysis of body length, head size and 3D LightSheet analysis: (A) Bright-field images of ap1g1+/+ and ap1g1+/− larvae at 6 dpf. Lines indicate body length (blue), anterior head width (yellow) and posterior head width (red). Scale bars: 500 mm (B) Quantification of body length, anterior head width and posterior head width measurements of ap1g1+/+ and ap1g1+/− larvae. Data are mean from three independent experiments (n = 15, 13 and 16 for ap1g1+/+ and n = 12, 12 and 9 for ap1g1+/−. 3D Light Sheet analysis at 72 hpf: Lateral view and (C,E) dorsal view (D,F) of the anterior part of the central nervous system of wild type and heterozygous embryos. Magnification 25×. (G), Quantification of total brain volume from. ap1g1+/+ and ap1g1+/− embryos at 72 hpf. Data are mean ± s.e.m. for three independent experiments n = 15, 15 and 16 for ap1g1+/+, and n = 10, 10 and 10 for ap1g1+/− embryos, ** p < 0.01 (two-tailed t-test). 1 voxel = 8 µm3 Abbreviations: mb, midbrain; hb, hindbrain; mhb, midbrain hindbrain boundary; rc, retinal cells; snc, spinal cord neurons. PHENOTYPE:
|
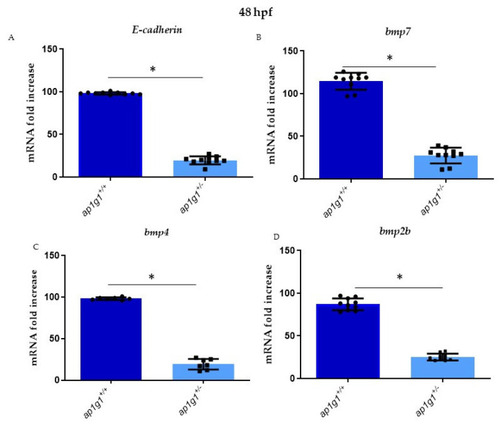
(A–D) Alterations of E-cadherin expression and different BMP factors in heterozygous and wild-type embryos, respectively: E-cadherin, bmp7, bmp4 and bmp2b. qPCR experiments were performed at 48 hpf in triplicate on cDNA samples derived from n = 30 whole embryos per condition to measure the mRNA level of E-cadherin and BMPs factor in ap1g1+/+ and ap1g1+/−. Gene expression was normalized using rpl13a as a reference gene and expressed as the mRNA fold increased. Data are representative of three replicates and are shown as the mean ± standard deviation; * p < 0.01 Student’s t-test, Statistical analysis was performed with GraphPad Version 8.3.3 GraphPad Software, Inc., Version La Jolla, CA, USA. |