
|
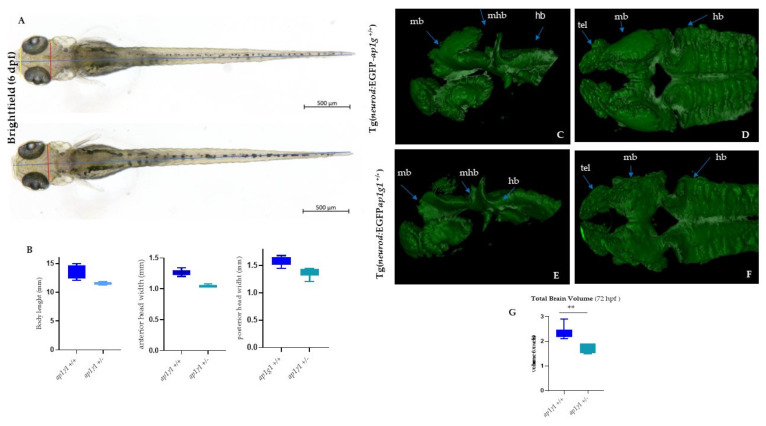
Figure 6
Analysis of body length, head size and 3D LightSheet analysis: (A) Bright-field images of ap1g1+/+ and ap1g1+/− larvae at 6 dpf. Lines indicate body length (blue), anterior head width (yellow) and posterior head width (red). Scale bars: 500 mm (B) Quantification of body length, anterior head width and posterior head width measurements of ap1g1+/+ and ap1g1+/− larvae. Data are mean from three independent experiments (n = 15, 13 and 16 for ap1g1+/+ and n = 12, 12 and 9 for ap1g1+/−. 3D Light Sheet analysis at 72 hpf: Lateral view and (C,E) dorsal view (D,F) of the anterior part of the central nervous system of wild type and heterozygous embryos. Magnification 25×. (G), Quantification of total brain volume from. ap1g1+/+ and ap1g1+/− embryos at 72 hpf. Data are mean ± s.e.m. for three independent experiments n = 15, 15 and 16 for ap1g1+/+, and n = 10, 10 and 10 for ap1g1+/− embryos, ** p < 0.01 (two-tailed t-test). 1 voxel = 8 µm3 Abbreviations: mb, midbrain; hb, hindbrain; mhb, midbrain hindbrain boundary; rc, retinal cells; snc, spinal cord neurons.