
- Title
-
A CRISPR/Cas9-generated mutation in the zebrafish orthologue of PPP2R3B causes idiopathic scoliosis
- Authors
- Seda, M., Crespo, B., Corcelli, M., Osborn, D.P., Jenkins, D.
- Source
- Full text @ Sci. Rep.
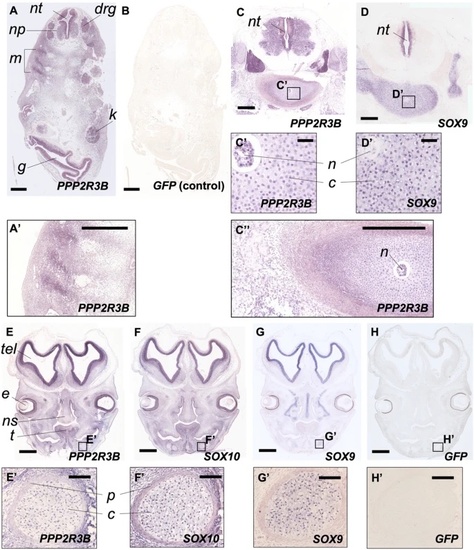
PPP2R3B is expressed at sites of chondrogenesis in normal human foetuses. Expression of PPP2R3B, SOX9 and SOX10 in normal human foetuses at Carnegie stages (CS) 17 (A, B) 23 (C, D) and 22 (E–H). (A, B) In situ hybridisation at low power showing expression of PPP2R3B within interneuron/motor neuron precursors (np), dorsal root ganglia (drg) and myotome (m) but no signal generated using a GFP negative control. (C, D) Expression of PPP2R3B in vertebral bodies. Insets show regions magnified in C’ and D’. Note expression in chondrocytes (c). PPP2R3B is also expressed in the notochord (n) whereas SOX9 is not. (E–H) Expression of PPP2R3B within Meckel’s cartilage (insets magnified in E’–H’). Note expression co-localises with SOX10 and SOX9 within chondrocytes (c) but expression is absent from perichondrium (p). nt, neural tube; g, gut; k, kidney; tel, telencephalon; e, eye; ns, nasal septum; t, tongue. Scale bars are 500 µm in (A–D, A’, C’); 60 µm in (C’, D’); 1 mm (E–H); 10 µm in (E’–H’). |
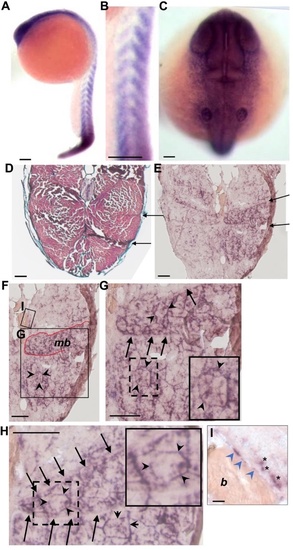
Expression of ppp2r3b in zebrafish. (A–C) In situ hybridisation showing expression of ppp2r3b at 24 hpf. High-power view showing expression in somites (B) and rostally (C). (D) Transverse section of 36 dpf zebrafish stained with Mallory’s trichrome. Arrows indicate examples of myosepta separating bundles of muscles fibres. (E) Similar section to (D) showing expression of ppp2r3b at 36 dpf. Arrows indicate myosepta that define muscle bundles outlined in red (mb, F). (G, H) Higher magnification images whereby arrows indicate myosepta, and arrowheads indicate staining around individual muscle fibres. Dashed boxes show the location of the insets which individual muscle fibres at higher magnification. (I) Inset from F showing mineralised bone (b) within vertebral centra showing expression of ppp2r3b in squamous chordoblast cells (arrowheads). Asterisks label individually staining cells of distinct morphology. Scale bars are 200 µm in (A, B); 40 µm in (C); 150 µm in (D–H); 12 µm in (I). |
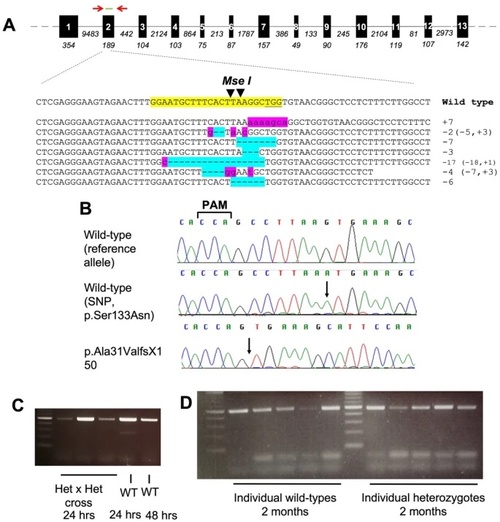
Targeting ppp2r3b in zebrafish using gene-editing. (A) ppp2r3b gene structure showing the location of primers used for genotyping (red arrows) and sgRNA (green) used for gene-editing. Below, examples of mutant sequence reads cloned from pooled F0 embryos. The sgRNA site is highlighted in yellow within the wild-type sequence. Inserted and deleted nucleotides are highlighted in pink and blue, respectively. (B) Sequence chromatograms showing the homozygous wild-type reference and alternative alleles, and the homozygous and heterozygous mutant reads. (C, D) RT-PCR showing expression of ppp2r3b using primers located within (C, D) exons 1–3 (band at expected size, 491 bp) or (D) or exons 1–7 (band at expected size, 1000 bp) at the indicated stages. |

ppp2r3b mutants are viable at all ages. Proportions of wild-type (WT), heterozygous (Het) and homozygous (Hom) mutant (ppp2r3bAla31ValfsX150) animals at the stated ages. Total numbers of embryos analysed are indicated. PHENOTYPE:
|
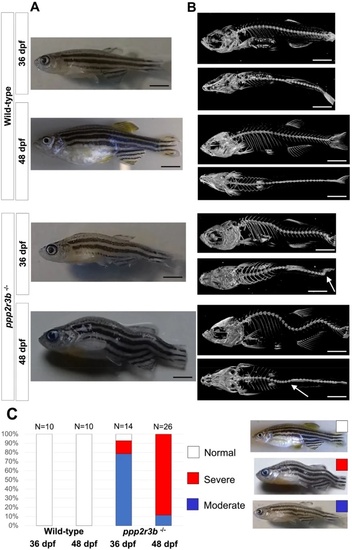
(A) Bright field images and (B) microCT scans of representative wild-type or homozygous ppp2r3b−/− mutant zebrafish at 36 or 48 dpf. White arrows in (B) point to sharp lateral curvatures of the spine. (C) Quantification of the proportion of animals with mild, moderate or severe kyphoscoliosis. Numbers of animals are given. Scale bars are 5 mm. All animals were generation F4. PHENOTYPE:
|
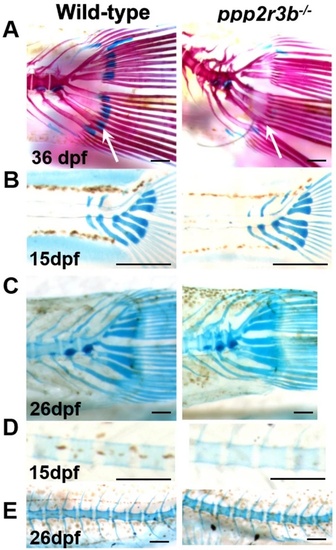
Temporal analysis of cartilage. Articular cartilage within the hypural bones is lost by 36 dpf (A, arrows) in ppp2r3b−/− mutants but forms normally at 15 dpf (B) and is maintained until 26 dpf (C). Within the vertebral bodies, cartilage is induced and maintained normally (D, E) and is replaced by mineralised bone by 36 dpf (A, and data not shown) in mutants. Scales bars are (A) 2.5 mm, (B) 0.5 mm, (C) 2.5 mm, (D) 150 µm, (E) 5 mm. PHENOTYPE:
|
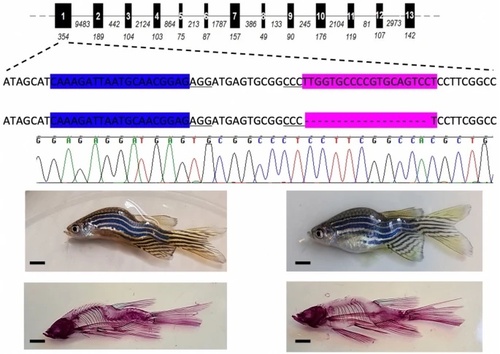
Scoliosis replicated in a mutant line encoding the mutation p.L82fsX24. Schematic of ppp2r3b showing the genic location of two sgRNAs used to target exon 1, highlighted in blue and pink, respectively. Deletion of 19 bp is indicated by ‘-’ symbols and the confirmatory sequence chromatogram is shown. Representative examples of two 3 month old zebrafish (above) stained for Alizarin red (below). All animals are generation F4. Scale bars are 5 mm. |
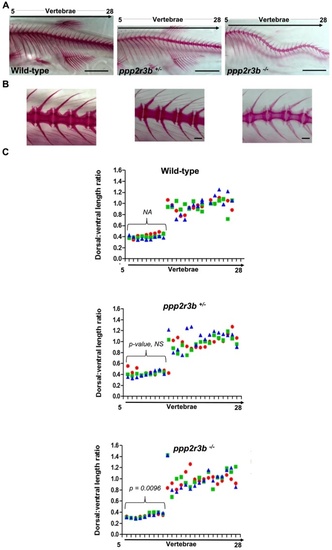
Morphometric analysis of mineralised bone. (A, B) Alizarin red staining of vertebrae 36 dpf zebrafish of the indicated genotypes. (C) Quantification of the neural spine:hemal spine/rib length ratios for vertebrae 5–28. Data-points for individual animals are indicated by different colours. Mean ± standard deviation of values of these ratios averaged across all ribs for each animal, indicated by the brackets, and subsequently averaged over three animals are 0.401 ± 0.024, 0.423 ± 0.029 and 0.335 ± 0.005 for wild-type, heterozygous and homozygous mutant animals, respectively (n = 3 animals). P-values compared to wild-type are indicated. This represents a statistically significant difference in homozygotes versus each of the other two genotypes (t-test). Tail lengths taking into account spinal curvature were 12.694, 12.872 and 12.749 mm for the representative wild-type, ppp2r3b+/− and ppp2r3b−/− animals shown, respectively. All animals are generation F4. Scale bars are 5 mm in (A); 2 mm in (B). PHENOTYPE:
|
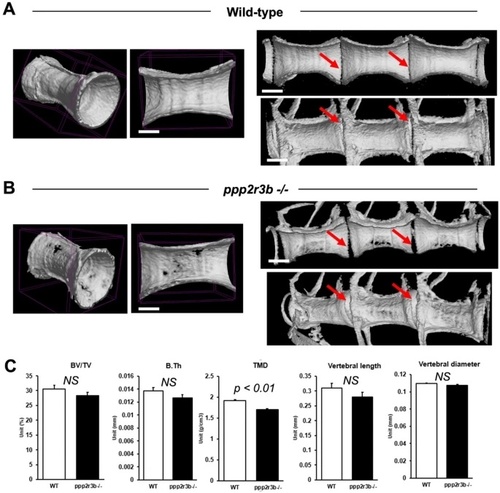
Reduced mineral density of vertebral cortical bone in ppp2r3b−/− mutants. (A, B) Representative 3D and cross-sectional images from microCT scans of vertebrae in wild-type and ppp2r3b−/− mutant zebrafish at 36 dpf. Note holes are apparent in the mutant vertebrae. Red arrows indicate intervertebral discs. (C) Quantification of a selection of cortical bone parameters measured in wild-type and ppp2r3b−/− mutant vertebrae (n = 3). BV/TV, bone volume/tissue volume; B.Th, bone thickness; TMD, tissue mineral density. p-values are given (t-test). NS, not significant. Average tail length (TL) for both mutant and wild-type animals was 12.6 mm with no difference between the two groups (p-value = 0.15, t-test). TLs of the two representative animals shown in (A) and (B) were 12.912 and 12.907 mm, respectively. Animals are generation F4. Scale bars are 5 mm in (A, B) left panel; 3.75 mm (A, B) right panels. PHENOTYPE:
|
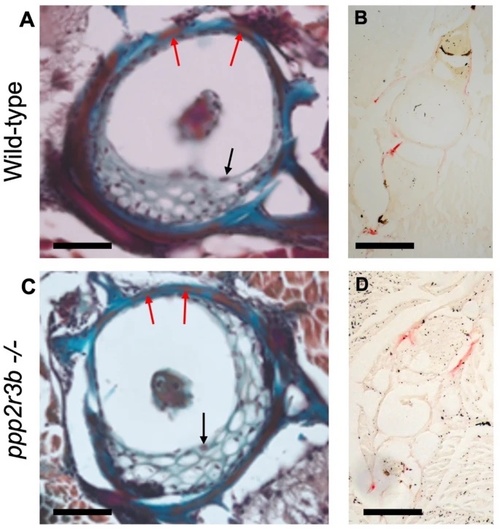
No obvious changes in osteoclast or osteoblast staining in vertebrae. (A, C) Mallory’s trichrome staining of vertebra centra. Black arrows show examples of vacuolated chordoblasts (osteoblasts) within the vertebra centrum while red arrows show squamous chordoblasts within the notochord sheath. (B, D) tartrate-resistant acid phosphatase (TRAP) staining in transverse sections from wild-type and ppp2r3b−/− mutant zebrafish at 36 dpf. Red signal indicates TRAP staining in neural and haemal arches, but no staining was detected within the vertebrae centra. Scale bars are 50 µm in (A, C); 14 µm in (B, D). PHENOTYPE:
|
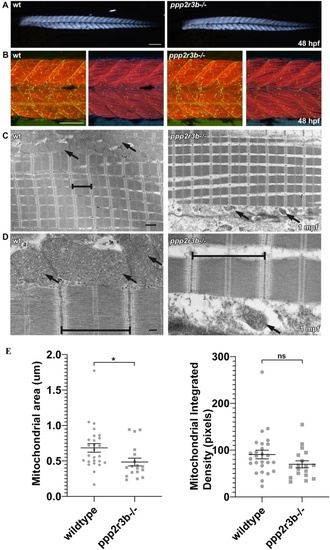
ppp2r3b mutants display abnormal mitochondria formation during adult stages of development, whilst muscle formation remains intact. (A) Skeletal muscle birefringence at 48hpf shows comparable muscle integrity between ppp2r3b mutants and wildtype siblings. Scale bar 200 µm. (B) Muscle fibres and motor neuron synapses appear normal in mutants compared to wildtype siblings at 48hpf, analysed by staining for F-Actin (Red) and Acetylcholine receptors (AChR, green) respectively. Left panels show a z-stack projection of F-Actin with AChR, right panels show a single focal plane of F-Actin/AChR/DAPI. Scale bar 100 µm. (C) Transmission electron micrographs indicate normal sarcomeric assembly (brackets) in juvenile mutants + compared to wildtype controls, however mitochondria (arrows) are noticeably malformed and less abundant. Scale bar 1 µm. (D) High magnification electron micrographs showing detailed images of the sarcomeres (brackets) and mitochondria (arrows) in wildtype compared to mutant adolescent muscle samples. Scale bar 200 nm. (E) Quantification of mitochondrial area adjacent to sarcomeres showed a statistically significant reduction in mutants (t-test) (n = 22 and 17 biological replicates for wild-type and ppp2r3b−/− animals, respectively). PHENOTYPE:
|