
Image
|
Figure Caption
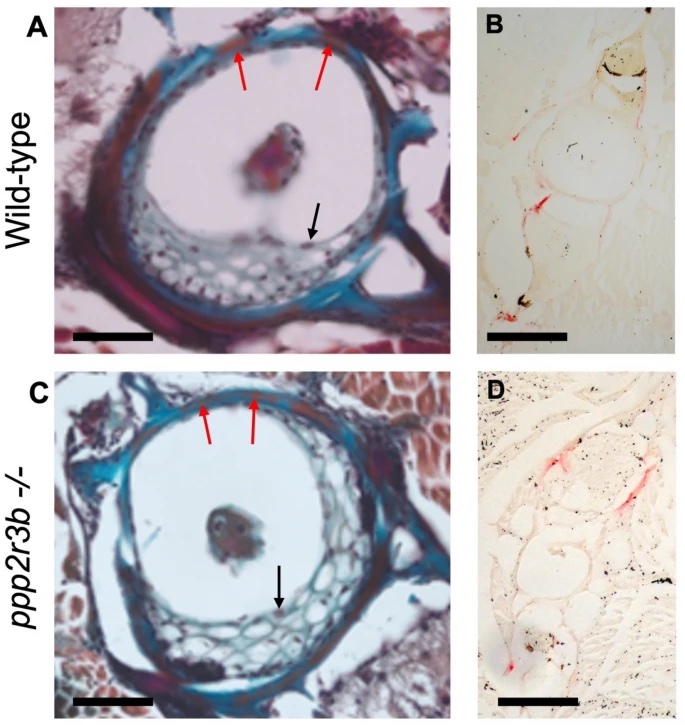
Fig. 10
No obvious changes in osteoclast or osteoblast staining in vertebrae. (A, C) Mallory’s trichrome staining of vertebra centra. Black arrows show examples of vacuolated chordoblasts (osteoblasts) within the vertebra centrum while red arrows show squamous chordoblasts within the notochord sheath. (B, D) tartrate-resistant acid phosphatase (TRAP) staining in transverse sections from wild-type and ppp2r3b−/− mutant zebrafish at 36 dpf. Red signal indicates TRAP staining in neural and haemal arches, but no staining was detected within the vertebrae centra. Scale bars are 50 µm in (A, C); 14 µm in (B, D).
Figure Data
Acknowledgments
This image is the copyrighted work of the attributed author or publisher, and
ZFIN has permission only to display this image to its users.
Additional permissions should be obtained from the applicable author or publisher of the image.
Full text @ Sci. Rep.